Virginia SOL 8.PS.3.f
The Standard
Sketch the line of best fit for data represented in a scatterplot.
Virginia Standards of Learning for Mathematics · The student will apply the data cycle (formulate questions; collect or acquire data; organize and represent data; and analyze data and communicate results) with a focus on scatterplots.
Teacher's field guide
What This Standard Means
What Students Need to Do
- Students examine the direction and shape of a scatterplot's overall trend. They sketch a straight line through the middle of the data, with points roughly balanced above and below it.
What Mastery Looks Like
- Students draw a straight line that follows the overall direction of the data and passes through the middle of the point cluster. The points are reasonably balanced above and below the line.
Common Misconceptions
- Students may connect the points, force the line through the origin, or draw a line using only two convenient points. They may also think every point must lie on the line.
How to Assess It
- Give students a scatterplot with a clear positive trend. Ask them to sketch a best-fit line and explain how the points on both sides support their choice.
Lesson moves
Ways to Teach It
Place sticky-note data points on a coordinate grid, then use string to test and choose a balanced best-fit line.
Show two possible lines on one scatterplot and ask students to write which is better, citing direction, center, and balance.
Play Line Judge by having pairs score sample lines for trend, central position, and balance above and below.
Graph study time and quiz scores from a sample class, then sketch a line that represents the overall relationship.
Free download
Printable 8.PS.3.f Worksheet
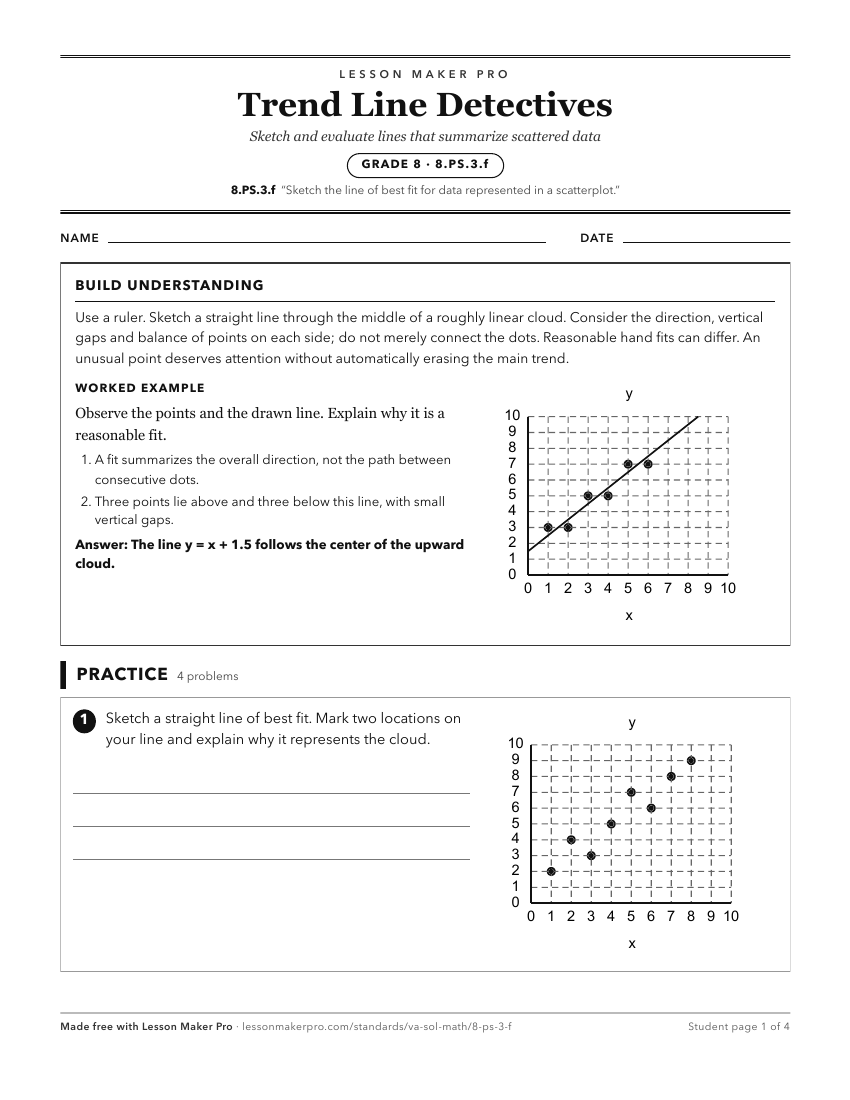
A ready-to-print activity worksheet aligned to 8.PS.3.f, with an answer key for the teacher on its own page. No account needed.
PDF, US Letter, prints cleanly in black and white.
Download the worksheetKeep exploring
Related Standards
- 7.PS.2.f
Compare data represented in histograms with the same data represented in other graphs, including but not limited to line plots (dot plots), circle graphs, and s...
- 8.PS.3.d
Make observations about a set of data points in a scatterplot as having a positive linear relationship, a negative linear relationship, or no relationship
- 8.PS.3.e
Analyze and justify the relationship of the quantitative bivariate data represented in scatterplots.
- 6.PS.2.a
Represent the mean of a set of data graphically as the balance point represented in a line plot (dot plot).
Turn this exact standard into a lesson
Grade, subject, topic, and the complete standard are prefilled. Create one free, no account needed.
Also for this standard:Make a WorksheetMake a QuizMake a Sub Lesson