Virginia SOL 6.PS.2.a
The Standard
Represent the mean of a set of data graphically as the balance point represented in a line plot (dot plot).
Virginia Standards of Learning for Mathematics · The student will represent the mean as a balance point and determine the effect on statistical measures when a data point is added, removed, or changed.
Teacher's field guide
What This Standard Means
What Students Need to Do
- Students plot each data value as a dot on a number line, stacking repeated values. They locate the mean and explain how distances on either side balance.
What Mastery Looks Like
- Given a data set, students draw an accurate dot plot and mark the mean, even when it falls between tick marks. They verify balance by comparing total distances to the left and right.
Common Misconceptions
- Students may choose the middle dot, confusing mean with median. They may ignore repeated values or assume the balance point must be a data value. Some compare dot counts instead of total distances on each side.
How to Assess It
- Exit ticket: Plot 2, 4, 4, 6, and 9, mark the mean, and label distances showing why the plot balances there.
Lesson moves
Ways to Teach It
Tape equal-weight washers at data values on a cardboard number line, then balance it on a pencil placed at the mean.
Ask, “Why can three nearby dots balance one faraway dot?” Students answer using distances from a marked mean.
Give pairs data cards and dot-plot grids; one student marks the mean, and the partner checks equal total distances.
Plot five daily temperatures, find the mean, and explain how warmer and cooler days balance around the weekly average.
Free download
Printable 6.PS.2.a Worksheet
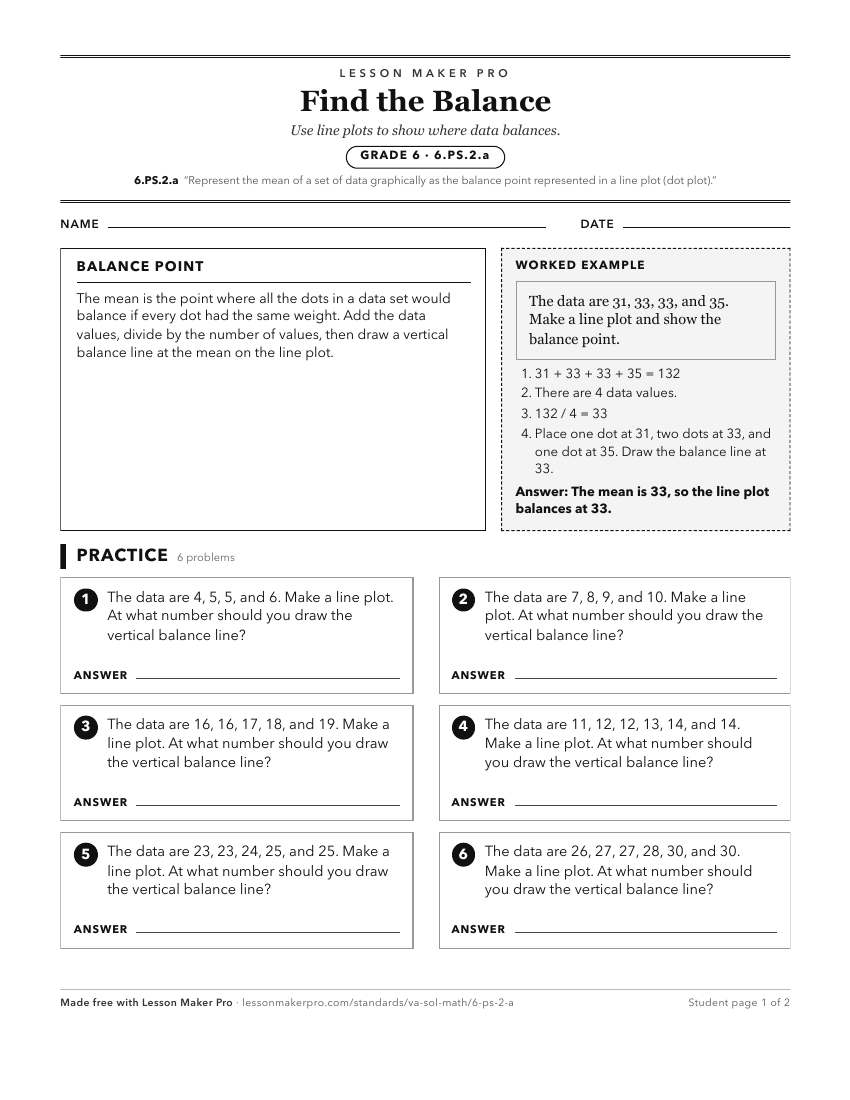
A ready-to-print activity worksheet aligned to 6.PS.2.a, with an answer key for the teacher on its own page. No account needed.
PDF, US Letter, prints cleanly in black and white.
Download the worksheetKeep exploring
Related Standards
- 6.PS.2
The student will represent the mean as a balance point and determine the effect on statistical measures when a data point is added, removed, or changed.
- 7.PS.2.f
Compare data represented in histograms with the same data represented in other graphs, including but not limited to line plots (dot plots), circle graphs, and s...
- 5.PS.1.c
Organize and represent a data set using a line plot (dot plot) with a title, labeled axes, and a key, with and without the use of technology tools. Lines plots ...
- 6.PS.1.f
Compare data represented in a circle graph with the same data represented in other graphs, including but not limited to bar graphs, pictographs, and line plots ...
Turn this exact standard into a lesson
Grade, subject, topic, and the complete standard are prefilled. Create one free, no account needed.
Also for this standard:Make a WorksheetMake a QuizMake a Sub Lesson