Virginia SOL 8.PS.3.e
The Standard
Analyze and justify the relationship of the quantitative bivariate data represented in scatterplots.
Virginia Standards of Learning for Mathematics · The student will apply the data cycle (formulate questions; collect or acquire data; organize and represent data; and analyze data and communicate results) with a focus on scatterplots.
Teacher's field guide
What This Standard Means
What Students Need to Do
- Students examine scatterplots to describe the direction, form, and strength of an association between two numerical variables. They justify conclusions using visible patterns, clusters, gaps, and outliers.
What Mastery Looks Like
- A student can identify positive, negative, or no association and describe the pattern as linear or nonlinear. The student judges its strength and supports the claim with clusters, gaps, or outliers.
Common Misconceptions
- Students may think a positive association means a desirable result rather than an upward pattern. They may claim one variable causes the other or ignore outliers that weaken the pattern.
How to Assess It
- Show a scatterplot of daily temperature and ice cream sales. Ask students to describe the association and justify their answer with two features from the graph.
Lesson moves
Ways to Teach It
Have students measure height and arm span, make a class scatterplot with sticky dots, then describe the relationship.
Show two scatterplots and ask, "Which relationship is stronger, and what visible evidence supports your choice?"
Run a card sort matching scatterplots with labels for direction, form, strength, and possible outliers.
Use local temperature and electricity-use data to create a scatterplot and write a claim about the association without claiming causation.
Free download
Printable 8.PS.3.e Worksheet
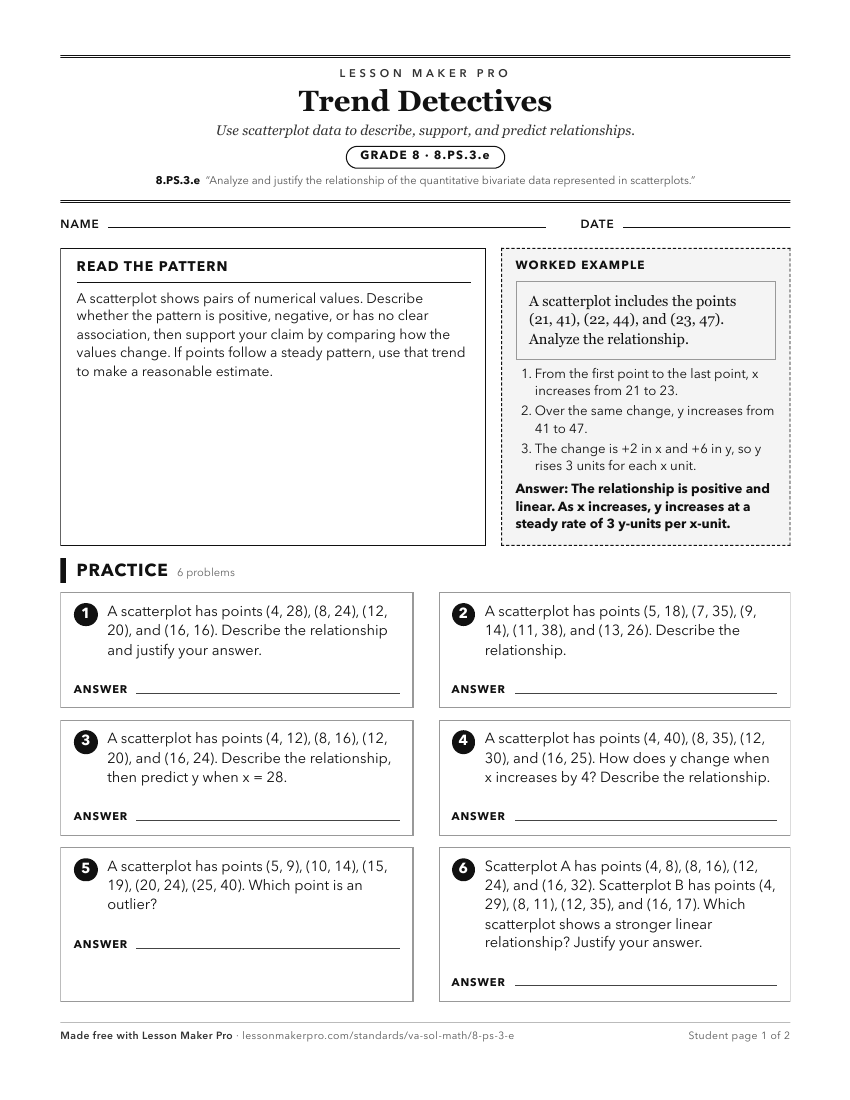
A ready-to-print activity worksheet aligned to 8.PS.3.e, with an answer key for the teacher on its own page. No account needed.
PDF, US Letter, prints cleanly in black and white.
Download the worksheetKeep exploring
Related Standards
- 7.PS.2.f
Compare data represented in histograms with the same data represented in other graphs, including but not limited to line plots (dot plots), circle graphs, and s...
- 8.PS.3.c
Organize and represent numeric bivariate data using scatterplots with and without the use of technology.
- 8.PS.3.d
Make observations about a set of data points in a scatterplot as having a positive linear relationship, a negative linear relationship, or no relationship
- 8.PS.2.h
Compare and analyze two data sets represented in boxplots.
Turn this exact standard into a lesson
Grade, subject, topic, and the complete standard are prefilled. Create one free, no account needed.
Also for this standard:Make a WorksheetMake a QuizMake a Sub Lesson