Virginia SOL 8.PS.2
SOL Standard (Knowledge and Skills Cluster)
The student will apply the data cycle (formulate questions; collect or acquire data; organize and represent data; and analyze data and communicate results) with a focus on boxplots.
Virginia Standards of Learning for Mathematics
Cluster contents
Knowledge and Skills in This Standard
8.PS.2 is a Standards of Learning standard. These are the knowledge and skills expectations under it.
- 8.PS.2.a
Formulate questions that require the collection or acquisition of data with a focus on boxplots.
- 8.PS.2.b
Determine the data needed to answer a formulated question and collect the data (or acquire existing data) using various methods (e.g., observations, measurement...
- 8.PS.2.c
Determine how statistical bias might affect whether the data collected from the sample is representative of the larger population.
- 8.PS.2.d
Organize and represent a numeric data set of no more than 20 items, using boxplots, with and without the use of technology.
- 8.PS.2.e
Identify and describe the lower extreme (minimum), upper extreme (maximum), median, upper quartile, lower quartile, range, and interquartile range given a data ...
- 8.PS.2.f
Describe how the presence of an extreme data point (outlier) affects the shape and spread of the data distribution of a boxplot.
- 8.PS.2.g
Analyze data represented in a boxplot by making observations and drawing conclusions.
- 8.PS.2.h
Compare and analyze two data sets represented in boxplots.
- 8.PS.2.i
Given a contextual situation, justify which graphical representation (e.g., pictographs, bar graphs, line graphs, line plots/dot plots, stem-and-leaf plots, cir...
- 8.PS.2.j
Identify components of graphical displays that can be misleading.
Teacher's field guide
What This Cluster Means
What Students Need to Do
- Students ask a measurable question, gather numerical data from a suitable sample, and organize the results in a boxplot. They interpret and compare medians, quartiles, ranges, IQRs, and outliers, then explain conclusions and possible bias.
What Mastery Looks Like
- Students can order up to 20 values, find the five-number summary, calculate range and IQR, and draw an accurate boxplot. They can compare centers and spreads, explain an outlier's effect, and spot biased samples or misleading displays.
Common Misconceptions
- Students may think quartiles divide the number line into equal intervals rather than divide the ordered data into four groups. They often confuse range with interquartile range or assume every maximum is an outlier. They may also overlook biased sampling and misleading scales.
How to Assess It
- Give students the data 4, 5, 6, 6, 7, 8, 9, 10, 11, 12, 13, 30. Ask them to draw and label a boxplot, find the range and IQR, and explain how removing 30 changes the spread.
Lesson moves
Ways to Teach It
Have students measure 15 hand spans, sort the values, then use yarn and index cards to build a floor boxplot.
Have students write which bus route is more reliable from two boxplots, citing medians, IQRs, and extremes.
Play Boxplot Match: teams pair data sets, five-number summaries, and boxplots, then explain each match before claiming a point.
Use delivery-time data from two stores to choose the more predictable option and discuss whether one week of orders is representative.
Free download
Printable 8.PS.2 Worksheet
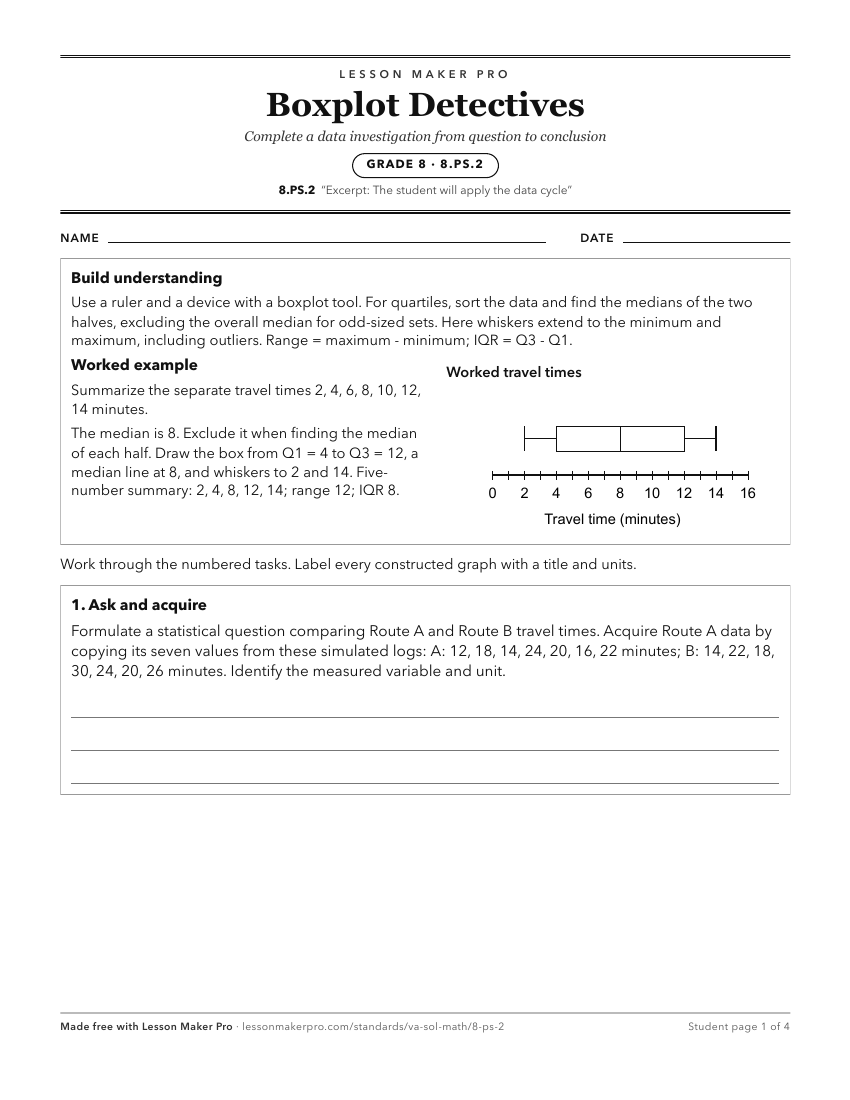
A ready-to-print activity worksheet aligned to 8.PS.2, with an answer key for the teacher on its own page. No account needed.
PDF, US Letter, prints cleanly in black and white.
Download the worksheetKeep exploring
Related Standards
- 4.PS.1
The student will apply the data cycle (formulate questions; collect or acquire data; organize and represent data; and analyze data and communicate results) with...
- 7.PS.2
The student will apply the data cycle (formulate questions; collect or acquire data; organize and represent data; and analyze data and communicate results) with...
- 6.PS.1
The student will apply the data cycle (formulate questions; collect or acquire data; organize and represent data; and analyze data and communicate results) with...
- 8.PS.3
The student will apply the data cycle (formulate questions; collect or acquire data; organize and represent data; and analyze data and communicate results) with...
Turn this cluster into a lesson
Grade, subject, topic, and the complete cluster are prefilled. Create one free, no account needed.
Also for this cluster:Make a WorksheetMake a QuizMake a Sub Lesson