Virginia SOL 8.PS.2.f
The Standard
Describe how the presence of an extreme data point (outlier) affects the shape and spread of the data distribution of a boxplot.
Virginia Standards of Learning for Mathematics · The student will apply the data cycle (formulate questions; collect or acquire data; organize and represent data; and analyze data and communicate results) with a focus on boxplots.
Teacher's field guide
What This Standard Means
What Students Need to Do
- Students compare boxplots made from a data set before and after an extreme value is added or removed. They describe which side stretches and use the range, IQR, and median to explain changes.
What Mastery Looks Like
- A student can identify a longer left or right tail and show that the range changes sharply. The student calculates quartiles to determine whether the IQR and median changed, rather than assuming they always do.
Common Misconceptions
- Students often think an outlier changes the median and IQR as much as it changes the range. They may also discard the extreme value automatically or call the distribution skewed without identifying the longer side.
How to Assess It
- Exit ticket: For 4, 5, 5, 6, 6, 7, 8, 30, sketch a boxplot, then remove 30 and sketch again. Name two changes in shape or spread.
Lesson moves
Ways to Teach It
Lay a floor number line, place cards for 4, 5, 5, 6, 6, 7, 8, then add 30 and redraw the boxplot.
Write three sentences comparing boxplots with and without 30, naming the longer side and changes in range, IQR, and median.
Show pairs of boxplots, and award teams a point for identifying the outlier and correctly describing two resulting changes.
Compare delivery-time boxplots before and after one 90-minute delay, then decide whether range or IQR better summarizes usual delivery times.
Free download
Printable 8.PS.2.f Worksheet
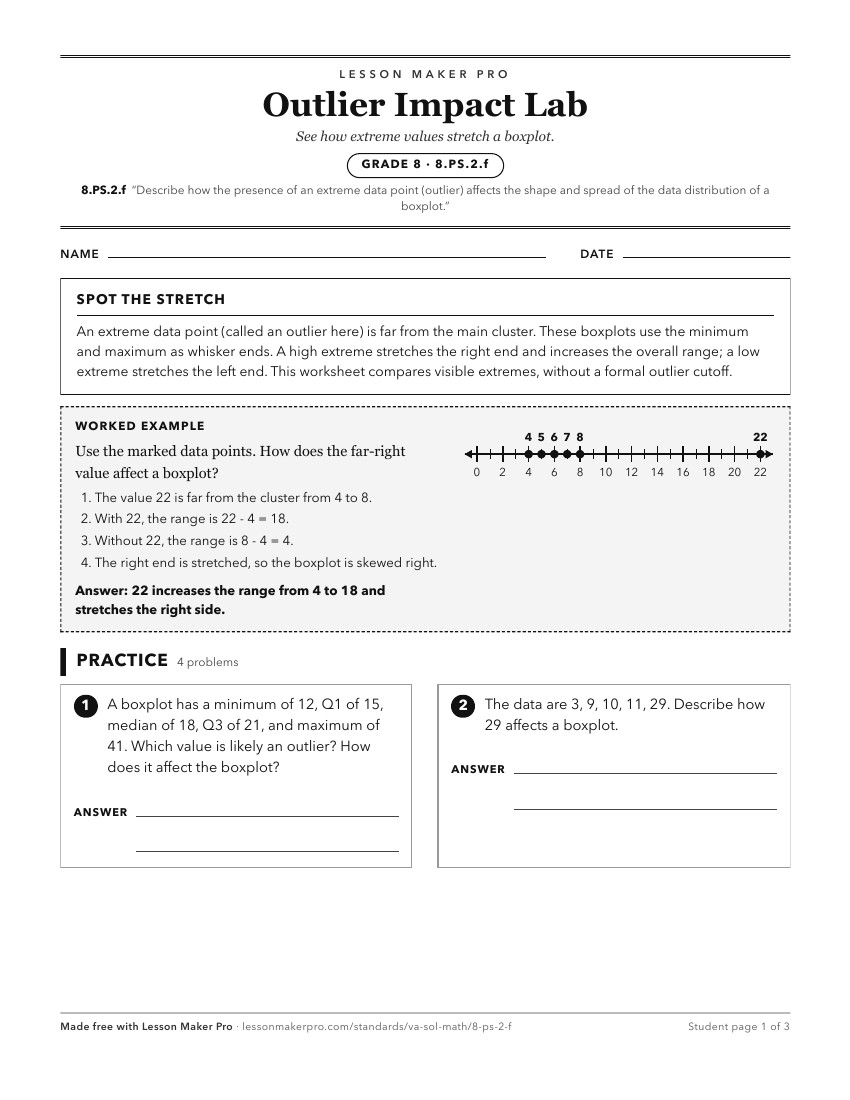
A ready-to-print activity worksheet aligned to 8.PS.2.f, with an answer key for the teacher on its own page. No account needed.
PDF, US Letter, prints cleanly in black and white.
Download the worksheetKeep exploring
Related Standards
- 8.PS.2.g
Analyze data represented in a boxplot by making observations and drawing conclusions.
- 8.PS.2.e
Identify and describe the lower extreme (minimum), upper extreme (maximum), median, upper quartile, lower quartile, range, and interquartile range given a data ...
- 6.PS.2.c
Observe patterns in data to identify outliers and determine their effect on mean, median, mode, or range.
- 8.PS.2.h
Compare and analyze two data sets represented in boxplots.
Turn this exact standard into a lesson
Grade, subject, topic, and the complete standard are prefilled. Create one free, no account needed.
Also for this standard:Make a WorksheetMake a QuizMake a Sub Lesson