Virginia SOL 6.PS.2.c
The Standard
Observe patterns in data to identify outliers and determine their effect on mean, median, mode, or range.
Virginia Standards of Learning for Mathematics · The student will represent the mean as a balance point and determine the effect on statistical measures when a data point is added, removed, or changed.
Teacher's field guide
What This Standard Means
What Students Need to Do
- Students examine a data set and spot values that lie far from the main pattern. They determine how an outlier affects the mean, median, mode, and range.
What Mastery Looks Like
- Students identify an unusually distant value by examining the overall data pattern. They correctly calculate each measure before and after a change, then explain which measures changed and why.
Common Misconceptions
- Students may label any value different from the others as an outlier. They may assume an outlier always changes every measure, or confuse range with the greatest value.
How to Assess It
- Give students the data set 4, 5, 5, 6, 20. Ask them to identify the outlier and explain how removing it affects each statistical measure.
Lesson moves
Ways to Teach It
Place number cards on a floor number line, identify the outlier, then remove it and recalculate mean, median, mode, and range.
Ask, “Should one unusually high test score change how we describe the class?” Students defend an answer using two statistical measures.
Give teams data cards; after each added, removed, or changed value, they predict which measures change before calculating.
Use a week of local temperatures plus one extreme reading to discuss how weather reports can be distorted by an outlier.
Free download
Printable 6.PS.2.c Worksheet
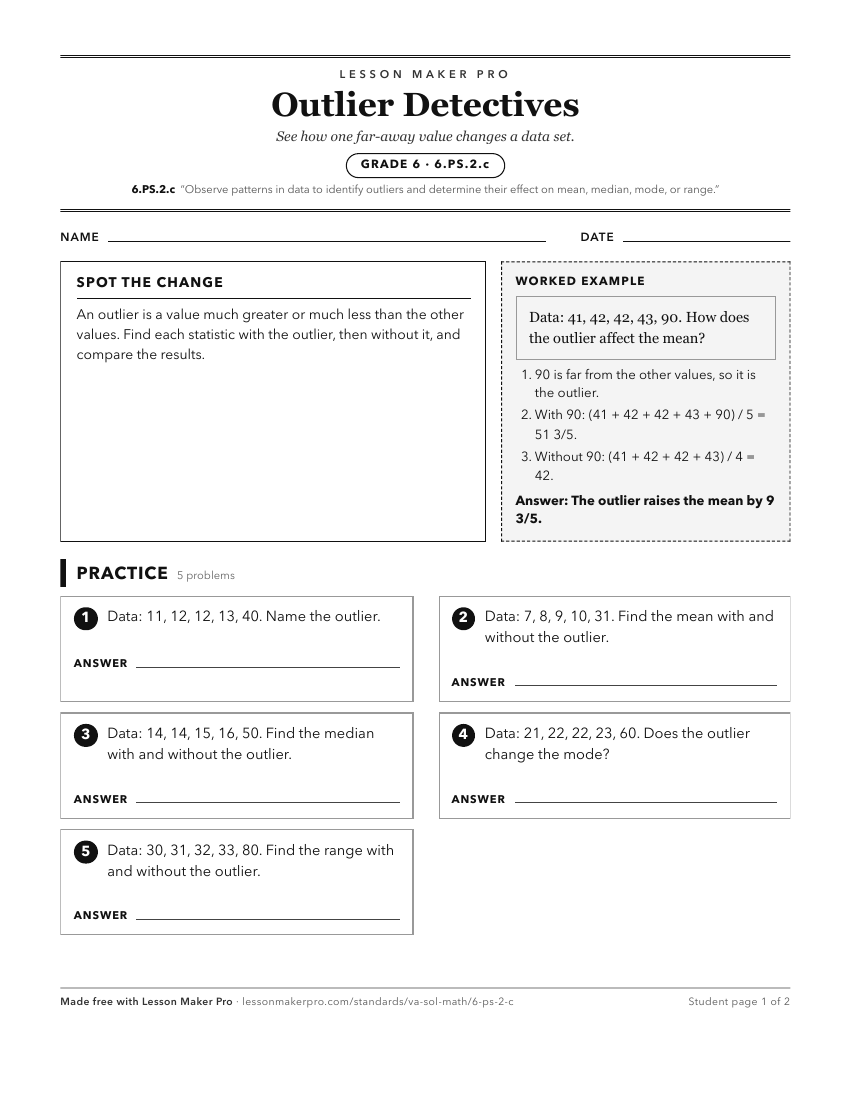
A ready-to-print activity worksheet aligned to 6.PS.2.c, with an answer key for the teacher on its own page. No account needed.
PDF, US Letter, prints cleanly in black and white.
Download the worksheetKeep exploring
Related Standards
- 7.PS.2.g
Analyze data represented in histograms by making observations and drawing conclusions. Determine how histograms reveal patterns in data that cannot be easily se...
- 6.PS.2.b
Determine the effect on measures of center when a single value of a data set is added, removed, or changed.
- 5.PS.2.c
Describe and determine the median of a set of data values representing data from a given context as a measure of center.
- 5.PS.2.d
Describe and determine the mode of a set of data values representing data from a given context as a measure of center.
Turn this exact standard into a lesson
Grade, subject, topic, and the complete standard are prefilled. Create one free, no account needed.
Also for this standard:Make a WorksheetMake a QuizMake a Sub Lesson