Virginia SOL 5.PS.2.c
The Standard
Describe and determine the median of a set of data values representing data from a given context as a measure of center.
Virginia Standards of Learning for Mathematics · The student will solve contextual problems using measures of center and the range.
Teacher's field guide
What This Standard Means
What Students Need to Do
- Students arrange data values from least to greatest and identify the center. For an even number of values, they find the mean of the two middle values and interpret the result in context.
What Mastery Looks Like
- Students order the values, locate the middle position, and calculate correctly when there are two middle values. They explain the median using the data’s context and units.
Common Misconceptions
- Students may choose the middle value before ordering the data. They may divide the total by the number of values, or forget to average the two middle values when the set has an even count.
How to Assess It
- Give students the data set 12, 7, 9, 15, 8, 11. Ask them to find the median and explain what it means in context.
Lesson moves
Ways to Teach It
Give pairs number cards to arrange in order, then have them mark the middle value or two middle values with counters.
Ask students to explain why ordering the values matters before finding the median, using a numerical example.
Play Median Match, where students pair data-set cards with the correct median cards and justify each match.
Use weekly temperatures or sports scores to find the median and write one sentence explaining what that value represents.
Free download
Printable 5.PS.2.c Worksheet
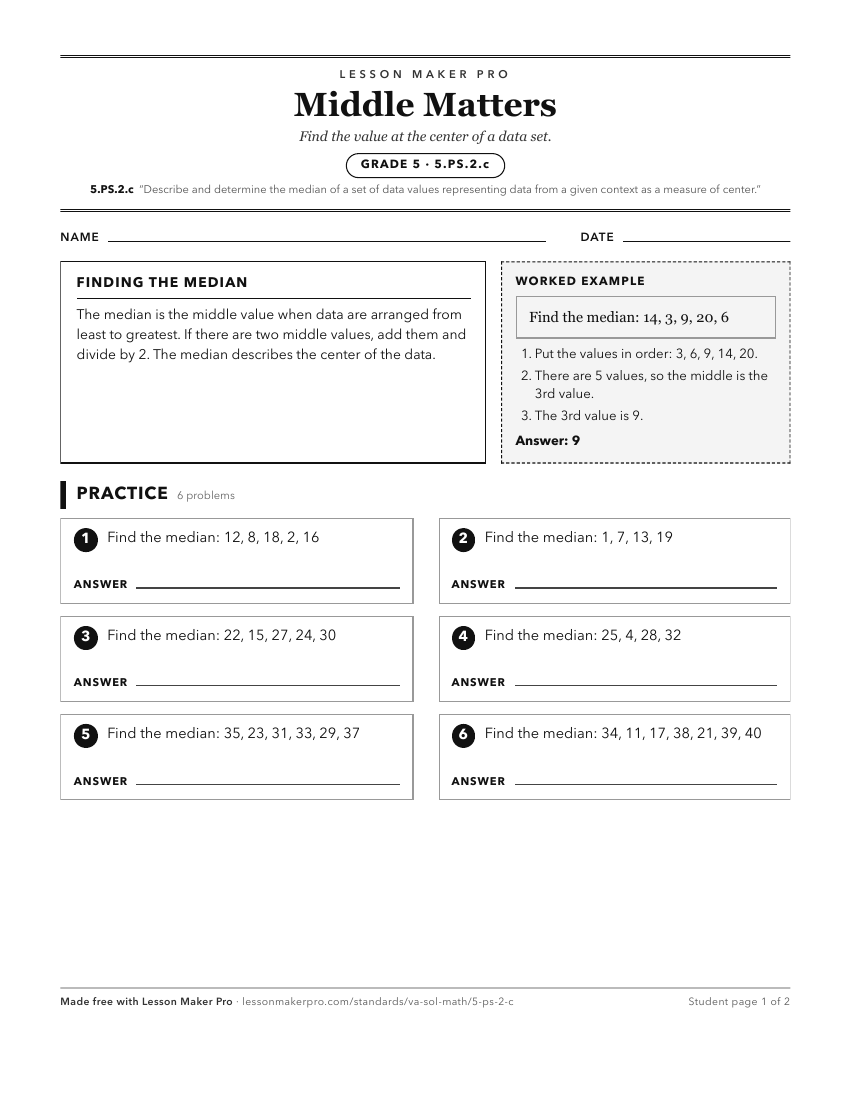
A ready-to-print activity worksheet aligned to 5.PS.2.c, with an answer key for the teacher on its own page. No account needed.
PDF, US Letter, prints cleanly in black and white.
Download the worksheetKeep exploring
Related Standards
- 5.PS.2.e
Describe and determine the range of a set of data values representing data from a given context as a measure of spread.
- 5.PS.2.b
Describe and determine the mean of a set of data values representing data from a given context as a measure of center.
- 6.PS.2.c
Observe patterns in data to identify outliers and determine their effect on mean, median, mode, or range.
- 5.PS.2.d
Describe and determine the mode of a set of data values representing data from a given context as a measure of center.
Turn this exact standard into a lesson
Grade, subject, topic, and the complete standard are prefilled. Create one free, no account needed.
Also for this standard:Make a WorksheetMake a QuizMake a Sub Lesson