Virginia SOL 7.PS.2.g
The Standard
Analyze data represented in histograms by making observations and drawing conclusions. Determine how histograms reveal patterns in data that cannot be easily seen by looking at the corresponding given data set.
Virginia Standards of Learning for Mathematics · The student will apply the data cycle (formulate questions; collect or acquire data; organize and represent data; and analyze data and communicate results) with a focus on histograms.
Teacher's field guide
What This Standard Means
What Students Need to Do
- Students read the height of each bar as a count within a number interval. They use peaks, clusters, gaps, and spread to describe the distribution and support conclusions.
What Mastery Looks Like
- A student accurately reads bin counts and identifies peaks, clusters, gaps, and overall spread. The student states a conclusion, cites specific intervals and frequencies, and explains what the graph shows more clearly than the raw list.
Common Misconceptions
- Students may read a bar's height as the largest value rather than the frequency in that interval. They may count a boundary value in both adjacent bins or ignore the interval labels. They may claim exact individual values from a histogram, which only shows grouped counts.
How to Assess It
- Give students a 20-value data set and its histogram. Ask them to name one pattern clearer in the histogram and support one conclusion with two bin counts.
Lesson moves
Ways to Teach It
Have groups sort numbered data cards into interval trays, then stack cubes for each interval to build and annotate a physical histogram.
Show raw commute times and their histogram; ask, “What pattern is clearer in the graph, and what evidence supports your claim?”
Play Histogram Detective: teams match four data sets to four histograms and earn points by citing bin counts, gaps, or clusters.
Graph one week of cafeteria wait times in two-minute bins, then write a staffing recommendation supported by the histogram.
Free download
Printable 7.PS.2.g Worksheet
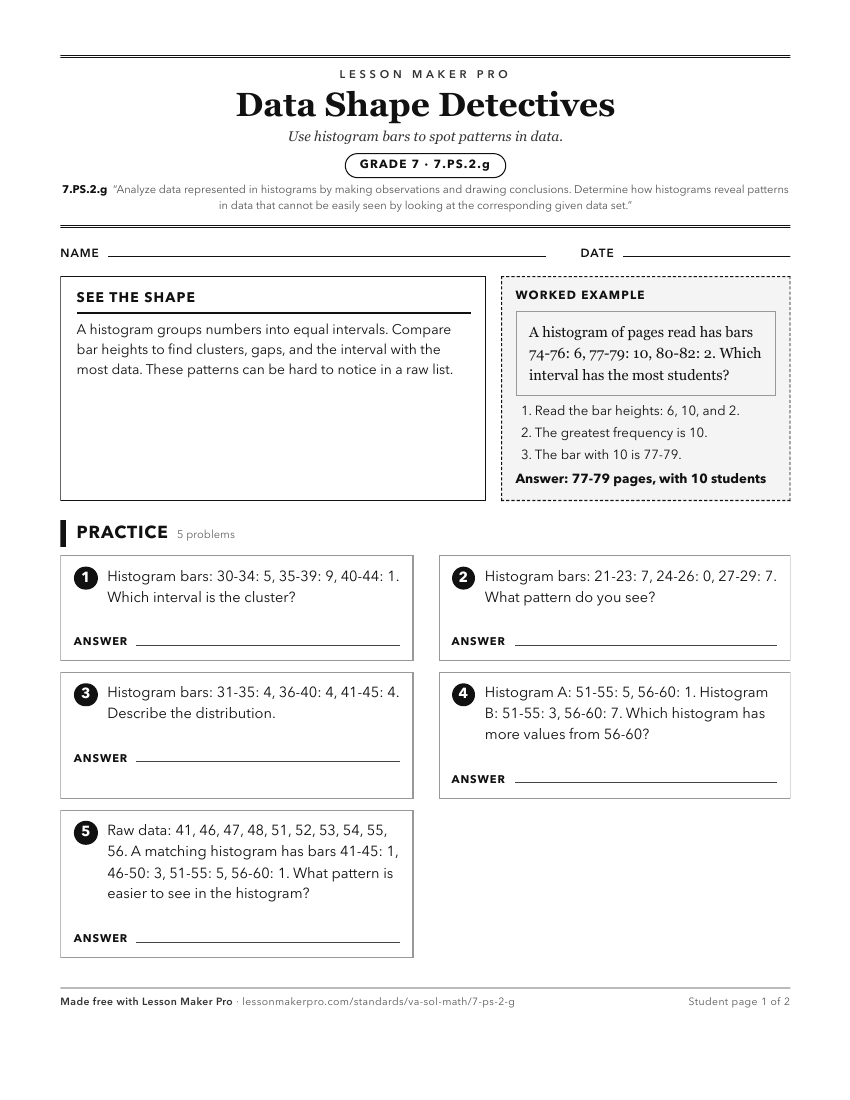
A ready-to-print activity worksheet aligned to 7.PS.2.g, with an answer key for the teacher on its own page. No account needed.
PDF, US Letter, prints cleanly in black and white.
Download the worksheetKeep exploring
Related Standards
- 8.PS.2.g
Analyze data represented in a boxplot by making observations and drawing conclusions.
- 7.PS.2.f
Compare data represented in histograms with the same data represented in other graphs, including but not limited to line plots (dot plots), circle graphs, and s...
- 7.PS.2.e
Investigate and explain how using different intervals could impact the representation of the data in a histogram.
- 6.PS.1.e
Analyze data represented in a circle graph by making observations and drawing conclusions.
Turn this exact standard into a lesson
Grade, subject, topic, and the complete standard are prefilled. Create one free, no account needed.
Also for this standard:Make a WorksheetMake a QuizMake a Sub Lesson