Virginia SOL 8.PS.2.j
The Standard
Identify components of graphical displays that can be misleading.
Virginia Standards of Learning for Mathematics · The student will apply the data cycle (formulate questions; collect or acquire data; organize and represent data; and analyze data and communicate results) with a focus on boxplots.
Teacher's field guide
What This Standard Means
What Students Need to Do
- Students inspect titles, labels, scales, intervals, symbols, and omitted information in graphs. They name the feature that could distort a reader’s conclusion and explain how to fix it.
What Mastery Looks Like
- Students can point to a specific feature, such as unequal intervals, missing labels, or inconsistent scales. They explain how that feature could affect a reader’s conclusion and suggest a clear correction.
Common Misconceptions
- Students may call any unusual shape misleading, even when the graph accurately shows the data. They may assume every axis must begin at zero, which is not required for a boxplot. They also miss unequal intervals, swapped labels, hidden outliers, or side-by-side plots using different scales.
How to Assess It
- Give students two side-by-side boxplots of class quiz scores that use different horizontal scales. Ask them to circle the misleading feature and explain how to revise it.
Lesson moves
Ways to Teach It
Give pairs two printed boxplots with mismatched scales; students cut out and align the axes, then write how the comparison changes.
Display a flawed boxplot and ask, “What conclusion might a reader make, and which design choice pushes that conclusion?”
Run a card-sort game where teams match misleading graphs to flaw cards such as unequal intervals, missing labels, or omitted outliers.
Have students inspect a news graphic or advertisement, mark one potentially misleading feature, and rewrite its caption accurately.
Free download
Printable 8.PS.2.j Worksheet
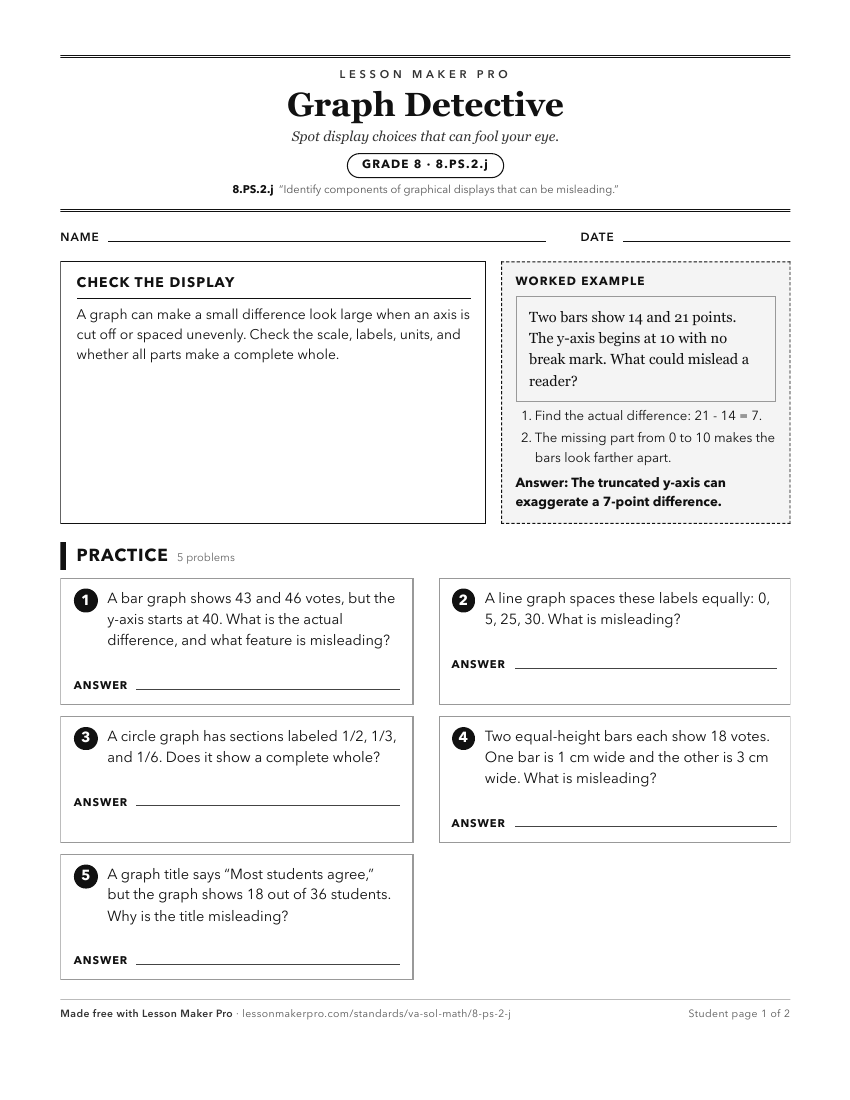
A ready-to-print activity worksheet aligned to 8.PS.2.j, with an answer key for the teacher on its own page. No account needed.
PDF, US Letter, prints cleanly in black and white.
Download the worksheetKeep exploring
Related Standards
- 7.PS.2.f
Compare data represented in histograms with the same data represented in other graphs, including but not limited to line plots (dot plots), circle graphs, and s...
- 8.PS.2.i
Given a contextual situation, justify which graphical representation (e.g., pictographs, bar graphs, line graphs, line plots/dot plots, stem-and-leaf plots, cir...
- 6.PS.1.f
Compare data represented in a circle graph with the same data represented in other graphs, including but not limited to bar graphs, pictographs, and line plots ...
- K.MG.2.a
Identify and name concrete and pictorial representations of circles, triangles, squares, and rectangles regardless of their orientation in space.
Turn this exact standard into a lesson
Grade, subject, topic, and the complete standard are prefilled. Create one free, no account needed.
Also for this standard:Make a WorksheetMake a QuizMake a Sub Lesson