Virginia SOL 8.PS.2.c
The Standard
Determine how statistical bias might affect whether the data collected from the sample is representative of the larger population.
Virginia Standards of Learning for Mathematics · The student will apply the data cycle (formulate questions; collect or acquire data; organize and represent data; and analyze data and communicate results) with a focus on boxplots.
Teacher's field guide
What This Standard Means
What Students Need to Do
- Students examine how a sample was chosen and identify sources of bias, such as convenience, voluntary response, undercoverage, or leading questions. They explain how bias could skew the data and limit conclusions about the full population.
What Mastery Looks Like
- Given a survey or sampling plan, students name the likely bias and identify who is overrepresented or missing. They predict the likely effect and explain whether the sample can reasonably describe the population.
Common Misconceptions
- Students may think a large sample is automatically representative or that varied results prove fair selection. They may confuse natural variation with bias, overlook excluded groups, or call results wrong without explaining the likely effect.
How to Assess It
- Exit ticket: A cafeteria survey asks only students buying school lunch to rate cafeteria food. Is the sample representative of all students, and how might the bias affect results?
Lesson moves
Ways to Teach It
Place colored counters in a bag, compare scoop samples from the top and mixed bag, then graph results and identify bias.
Write whether a lunch survey given only in the cafeteria represents all students, then name who is missing and predict the effect.
Play Bias Detective with scenario cards; teams label convenience, voluntary response, undercoverage, or leading wording and explain each effect.
Compare two headlines based on online polls, inspect how participants joined each poll, and decide which claim supports a population conclusion.
Free download
Printable 8.PS.2.c Worksheet
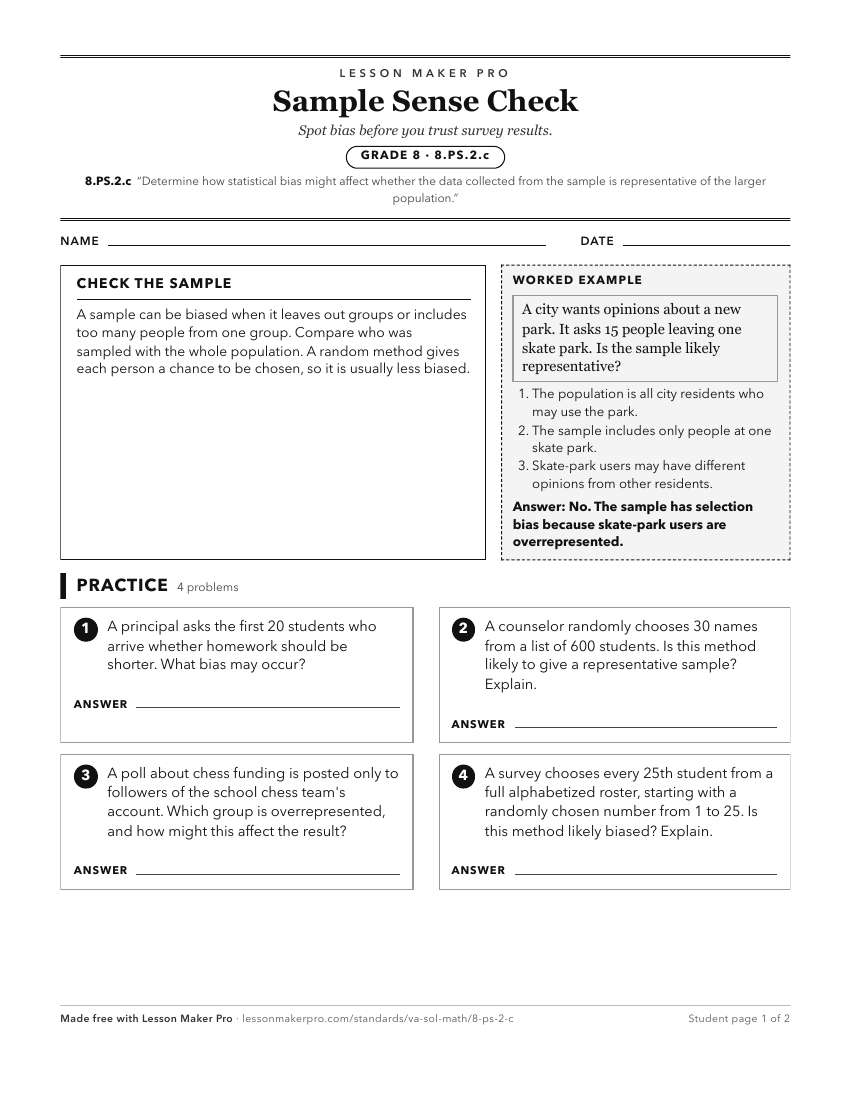
A ready-to-print activity worksheet aligned to 8.PS.2.c, with an answer key for the teacher on its own page. No account needed.
PDF, US Letter, prints cleanly in black and white.
Download the worksheetKeep exploring
Related Standards
- 6.PS.1.c
Determine the factors that will ensure that the data collected is a sample that is representative of a larger population.
- 2.PS.1.b
Determine the data needed to answer a posed question and collect the data using various methods (e.g., voting; creating lists, tables, or charts; tallying).
- 5.PS.1.b
Determine the data needed to answer a formulated question and collect or acquire existing data (limited to 30 or fewer data points) using various methods (e.g.,...
- 7.PS.2.c
Determine how sample size and randomness will ensure that the data collected is a sample that is representative of a larger population.
Turn this exact standard into a lesson
Grade, subject, topic, and the complete standard are prefilled. Create one free, no account needed.
Also for this standard:Make a WorksheetMake a QuizMake a Sub Lesson