Virginia SOL 7.PS.2.c
The Standard
Determine how sample size and randomness will ensure that the data collected is a sample that is representative of a larger population.
Virginia Standards of Learning for Mathematics · The student will apply the data cycle (formulate questions; collect or acquire data; organize and represent data; and analyze data and communicate results) with a focus on histograms.
Teacher's field guide
What This Standard Means
What Students Need to Do
- Students judge whether a sample is likely to represent a larger population. They examine sample size and selection method, then explain how random selection and larger samples improve reliability.
What Mastery Looks Like
- Students can identify whether a sampling plan uses random selection and an adequate sample size. They explain that randomness reduces selection bias and larger samples reduce variability, but neither guarantees a perfect match.
Common Misconceptions
- Students may think a large sample automatically represents the population, even when selection is biased. They may also confuse random selection with choosing people casually or spreading responses evenly across groups.
How to Assess It
- Give students two survey plans: 20 randomly selected students and 200 volunteers from one sports team. Ask which plan is more representative and what change would improve each plan.
Lesson moves
Ways to Teach It
Draw colored counters from a bag, compare samples of 5 and 30 to the known population proportions, and record which is closer.
Ask students to explain why surveying every tenth name on a school roster is usually better than surveying friends at lunch.
Sort sampling-plan cards into likely representative or likely biased, then earn a point by naming one specific improvement.
Examine a published poll and identify its population, sample size, selection method, and any reason the sample may not represent the population.
Free download
Printable 7.PS.2.c Worksheet
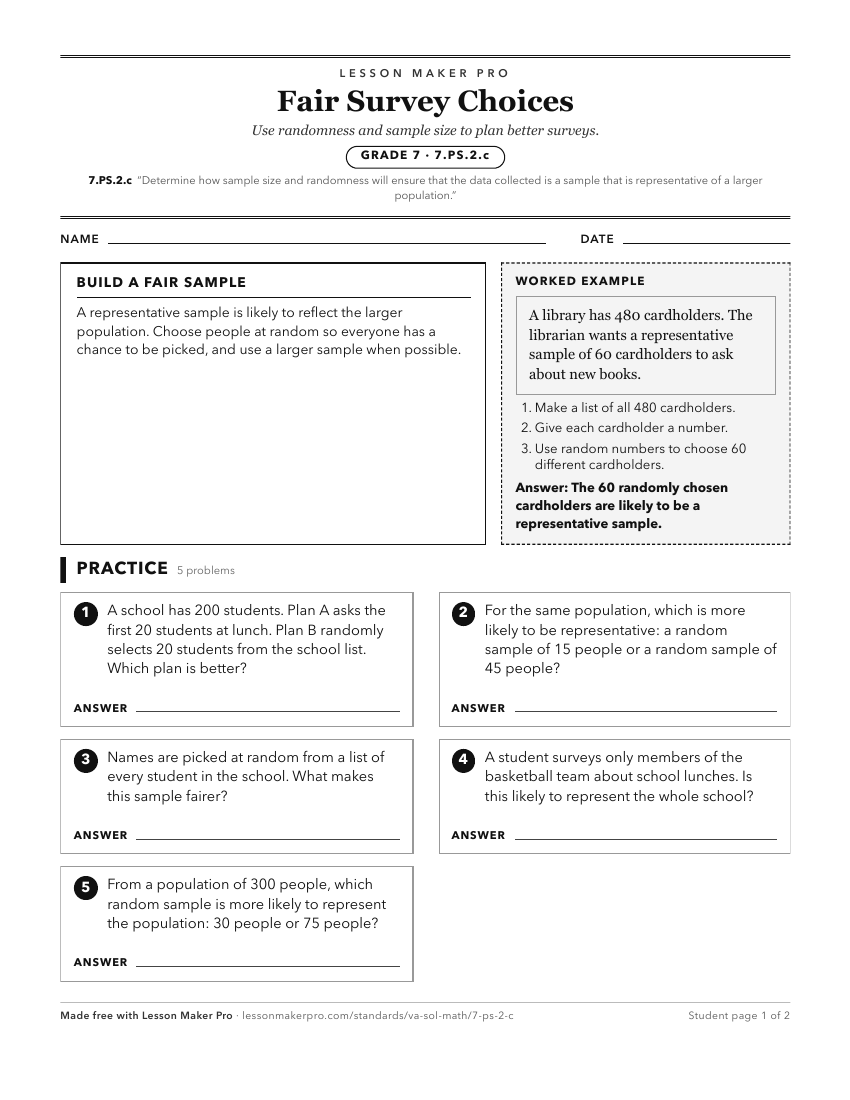
A ready-to-print activity worksheet aligned to 7.PS.2.c, with an answer key for the teacher on its own page. No account needed.
PDF, US Letter, prints cleanly in black and white.
Download the worksheetKeep exploring
Related Standards
- 6.PS.1.c
Determine the factors that will ensure that the data collected is a sample that is representative of a larger population.
- 8.PS.2.c
Determine how statistical bias might affect whether the data collected from the sample is representative of the larger population.
- 2.PS.1.b
Determine the data needed to answer a posed question and collect the data using various methods (e.g., voting; creating lists, tables, or charts; tallying).
- 5.PS.1.b
Determine the data needed to answer a formulated question and collect or acquire existing data (limited to 30 or fewer data points) using various methods (e.g.,...
Turn this exact standard into a lesson
Grade, subject, topic, and the complete standard are prefilled. Create one free, no account needed.
Also for this standard:Make a WorksheetMake a QuizMake a Sub Lesson