Virginia SOL 6.PS.1.d
The Standard
Organize and represent data using circle graphs, with and without the use of technology tools. The number of data values should be limited to allow for comparisons that have denominators of 12 or less or those that are factors of 100 (e.g., in a class of 20 students, 7 choose apples as a favorite fruit, so the comparison is 7 out of 20, 7 20 , or 35%).
Virginia Standards of Learning for Mathematics · The student will apply the data cycle (formulate questions; collect or acquire data; organize and represent data; and analyze data and communicate results) with a focus on circle graphs.
Teacher's field guide
What This Standard Means
What Students Need to Do
- Students turn category counts into parts of one whole and show those parts as proportional sectors in a circle graph. They label categories and values, and create graphs by hand and with a digital tool.
What Mastery Looks Like
- A student can use a total such as 12, 20, 25, or 100 to size each sector correctly. Their graph accounts for all data, totals one whole, includes clear labels, and supports an accurate comparison.
Common Misconceptions
- Students may use raw counts as percentages, draw equal sectors for unequal groups, or make sectors that do not total the whole circle. They may also omit labels, duplicate a category, or trust a software chart without checking the entered data.
How to Assess It
- Exit ticket: In a class of 20, 7 choose apples, 5 bananas, 4 oranges, and 4 grapes. On a circle divided into 20 equal sectors, shade and label each category, then state which fruit represents 35%.
Lesson moves
Ways to Teach It
Use 12 counters in three colors, then shade and label matching sections on a paper circle divided into 12 equal sectors.
Show two circle graphs for the same lunch survey and ask, “Which graph is accurate, and how do you know?”
Give pairs dataset cards and graph cards to match, then have partners check that every circle represents the full data set.
Survey 20 classmates about a favorite fruit, make a circle graph in a spreadsheet, and compare the largest and smallest groups.
Free download
Printable 6.PS.1.d Worksheet
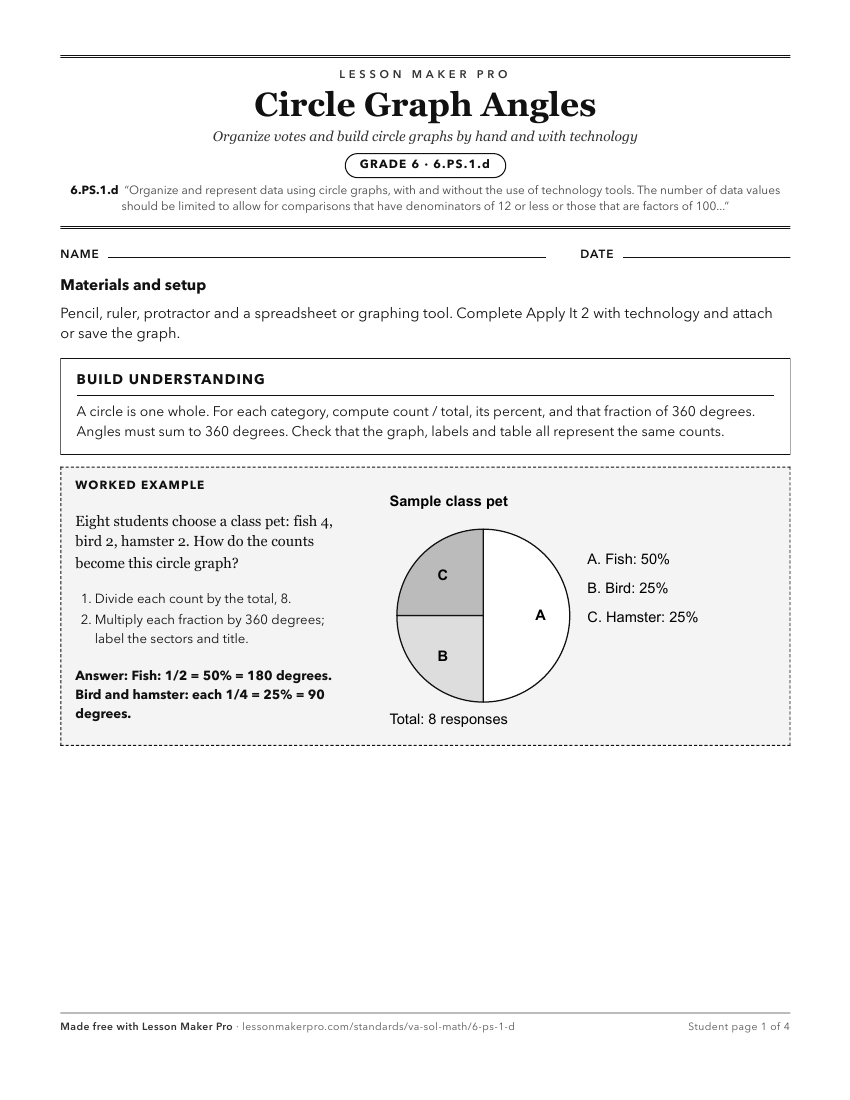
A ready-to-print activity worksheet aligned to 6.PS.1.d, with an answer key for the teacher on its own page. No account needed.
PDF, US Letter, prints cleanly in black and white.
Download the worksheetKeep exploring
Related Standards
- 4.PS.1.c
Organize and represent a data set using line graphs with a title and labeled axes with whole number increments, with and without the use of technology tools.
- 3.PS.1.d
Organize and represent a data set using bar graphs with a title and labeled axes, with and without the use of technology tools. Determine and use an appropriate...
- 8.PS.2.d
Organize and represent a numeric data set of no more than 20 items, using boxplots, with and without the use of technology.
- 7.PS.2.d
Organize and represent numerical data using histograms with and without the use of technology
Turn this exact standard into a lesson
Grade, subject, topic, and the complete standard are prefilled. Create one free, no account needed.
Also for this standard:Make a WorksheetMake a QuizMake a Sub Lesson