Virginia SOL 2.PS.1.e.ii
The Standard
draw conclusions about the data and make predictions based on the data.
Virginia Standards of Learning for Mathematics · The student will apply the data cycle (pose questions; collect or acquire data; organize and represent data; and analyze data and communicate results) with a focus on pictographs and bar graphs.
Teacher's field guide
What This Standard Means
What Students Need to Do
- Students read pictographs and bar graphs using titles, labels, keys, and scales. They compare categories, draw conclusions from the values, and make predictions supported by the data.
What Mastery Looks Like
- Students identify the greatest and least categories, compare values, and state conclusions supported by the graph. They make a reasonable prediction and explain which pattern or value supports it.
Common Misconceptions
- Students may count each picture as one and ignore a key showing that each picture represents two. They may misread a bar’s scale or compare bar widths instead of heights. They may base predictions on personal preference rather than graph evidence.
How to Assess It
- Display a bar graph titled Favorite Playground Area with slide 7, swings 4, and field 9. Ask students to write one conclusion and predict the next vote using one graph value.
Lesson moves
Ways to Teach It
Survey the class about a read-aloud choice, place sticky-note symbols on a pictograph, then state one conclusion and one prediction.
Ask, “What conclusion is supported, and what prediction can we make?” Require students to cite labels and values from the graph.
Play Graph Detective: pairs match conclusion and prediction cards to graphs, then reject cards that are not supported by the data.
Graph daily cafeteria fruit choices for one week, then predict which fruit may need the largest order next week and explain why.
Free download
Printable 2.PS.1.e.ii Worksheet
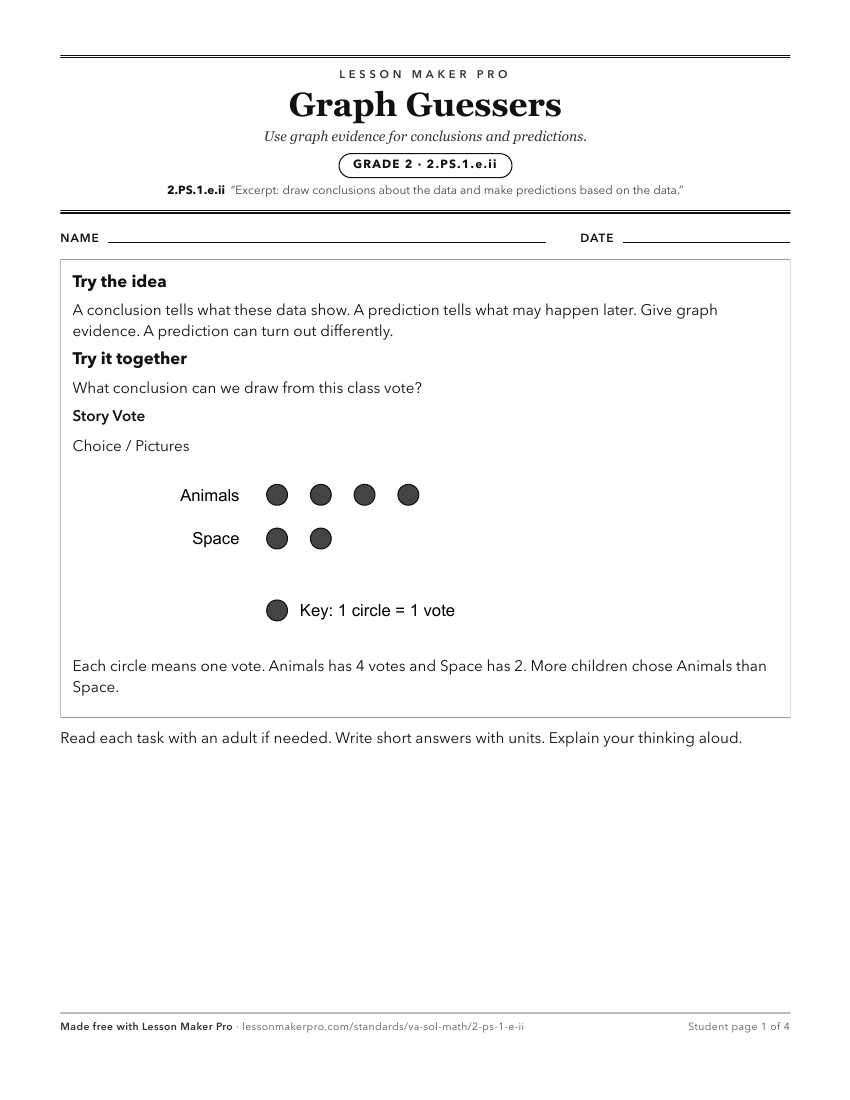
A ready-to-print activity worksheet aligned to 2.PS.1.e.ii, with an answer key for the teacher on its own page. No account needed.
PDF, US Letter, prints cleanly in black and white.
Download the worksheetKeep exploring
Related Standards
- K.PS.1.g.ii
The Kindergarten version of this standard.
- 5.PS.1.e.iv
draw conclusions about the data and make predictions based on the data to answer questions
- 4.PS.1.d.iv
draw conclusions about the data and make predictions based on the data to answer questions
- 1.PS.1.g.ii
The 1st Grade version of this standard.
Turn this exact standard into a lesson
Grade, subject, topic, and the complete standard are prefilled. Create one free, no account needed.
Also for this standard:Make a WorksheetMake a QuizMake a Sub Lesson