CCSS.
The Standard
Represent data on two quantitative variables on a scatter plot, and describe how the variables are related.
Common Core State Standards for Mathematics
Teacher's field guide
What This Standard Means
What Students Need to Do
- Students graph paired numerical data on a scatter plot. They describe the relationship by naming its direction, form, strength, and any outliers or clusters.
What Mastery Looks Like
- Students label both axes, choose sensible scales, and plot ordered pairs accurately. They describe direction, form, strength, and outliers using evidence from the graph.
Common Misconceptions
- Students may treat a negative association as no association or assume every pattern must be linear. They may ignore outliers, reverse the axes, or claim that association proves causation.
How to Assess It
- Exit ticket: Plot (1, 52), (2, 58), (3, 61), (4, 69), (5, 72), and (6, 85). Describe the direction, form, strength, and any unusual points.
Lesson moves
Ways to Teach It
Have pairs measure classmates' height and arm span, record ordered pairs, create a scatter plot, and describe the pattern.
Show a scatter plot and ask, "What claim can you make about the relationship, and what evidence supports it?"
Run a card sort matching scatter plots with descriptions of direction, form, strength, and outliers.
Graph local daily temperature against electricity use, then discuss whether the pattern suggests association, causation, or another influencing factor.
Free download
Printable HSS-ID.B.6 Worksheet
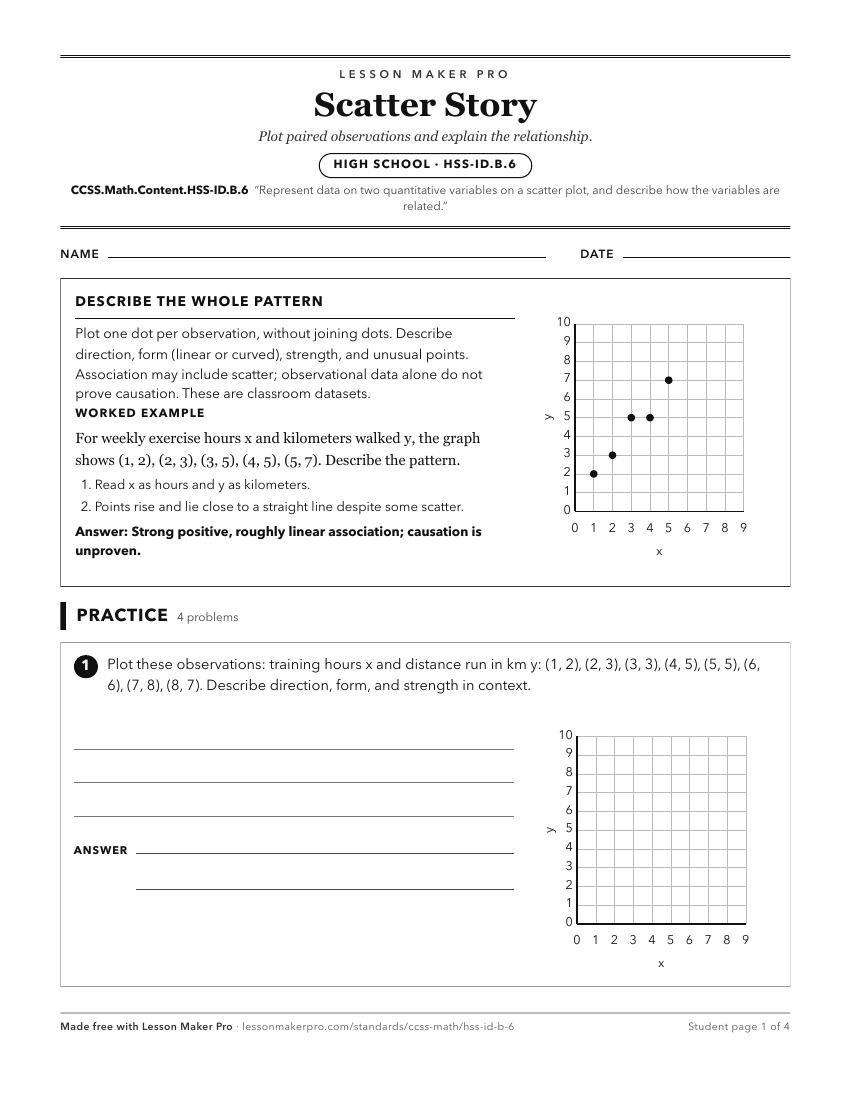
A ready-to-print activity worksheet aligned to CCSS.Math.Content.HSS-ID.B.6, with an answer key for the teacher on its own page. No account needed.
PDF, US Letter, prints cleanly in black and white.
Download the worksheetLearning progression
Where This Standard Sits
Before This Standard
If students are struggling here, check these first.
- CCSS.Math.Content.8.SP.A.1
Students must already plot paired quantitative data and recognize association patterns to describe relationships in high school scatter plots.
- CCSS.Math.Content.8.SP.A.2
Informal line fitting and judging closeness prepares students to describe form, direction, and strength in high school scatter plots.
- CCSS.Math.Content.8.F.B.5
Reading graph shape, direction, and linearity helps students describe patterns and relationships in scatter plots of two variables.
What This Unlocks
Mastery here sets students up for these next.
- CCSS.Math.Content.HSS-ID.C.9
Reading scatter plots and describing association gives students the correlation idea they must separate from causal claims.
- CCSS.Math.Content.HSS-ID.C.8
Scatter plots and describing linear association prepare students to interpret what the correlation coefficient says about direction and strength.
- CCSS.Math.Content.HSS-ID.B.6a
Scatter plots and describing association prepare students to choose and interpret a fitted function for two-variable data.
- CCSS.Math.Content.HSS-ID.B.6b
Residual plots use the same two-variable data and require understanding scatter plots and how a fitted function relates to the data.
Keep exploring
Related Standards
Turn this exact standard into a lesson
Grade, subject, topic, and the complete standard are prefilled. Create one free, no account needed.
Also for this standard:Make a WorksheetMake a QuizMake a Sub Lesson