CCSS.
The Standard
Fit a linear function for a scatter plot that suggests a linear association.
Common Core State Standards for Mathematics · Summarize, represent, and interpret data on two categorical and quantitative variables
Teacher's field guide
What This Standard Means
What Students Need to Do
- Students identify when a scatter plot has a roughly straight trend. They draw or calculate a reasonable model, write its equation, and use it to estimate values.
What Mastery Looks Like
- A student draws a line that follows the center of the data, with points reasonably balanced on both sides. The student finds a sensible slope and intercept from two points on the line, not necessarily data points.
Common Misconceptions
- Students may connect the dots instead of modeling the overall trend. They may use two outliers to find the slope or assume the line must pass through the origin. They may also ignore whether points are balanced above and below the line.
How to Assess It
- Give students a scatter plot and ask them to draw a reasonable trend line, write its equation, and explain why it fits.
Lesson moves
Ways to Teach It
Give pairs a printed scatter plot and a piece of uncooked spaghetti, then have them place and trace the best trend line.
Show two proposed lines for one scatter plot and ask students to write which fits better and cite two visual reasons.
Play Match the Model by having teams pair scatter plots with equation cards, then defend each match using slope and intercept.
Use local temperature and electricity-use data to create a scatter plot, estimate a trend line, and predict use for a new temperature.
Free download
Printable HSS-ID.B.6c Worksheet
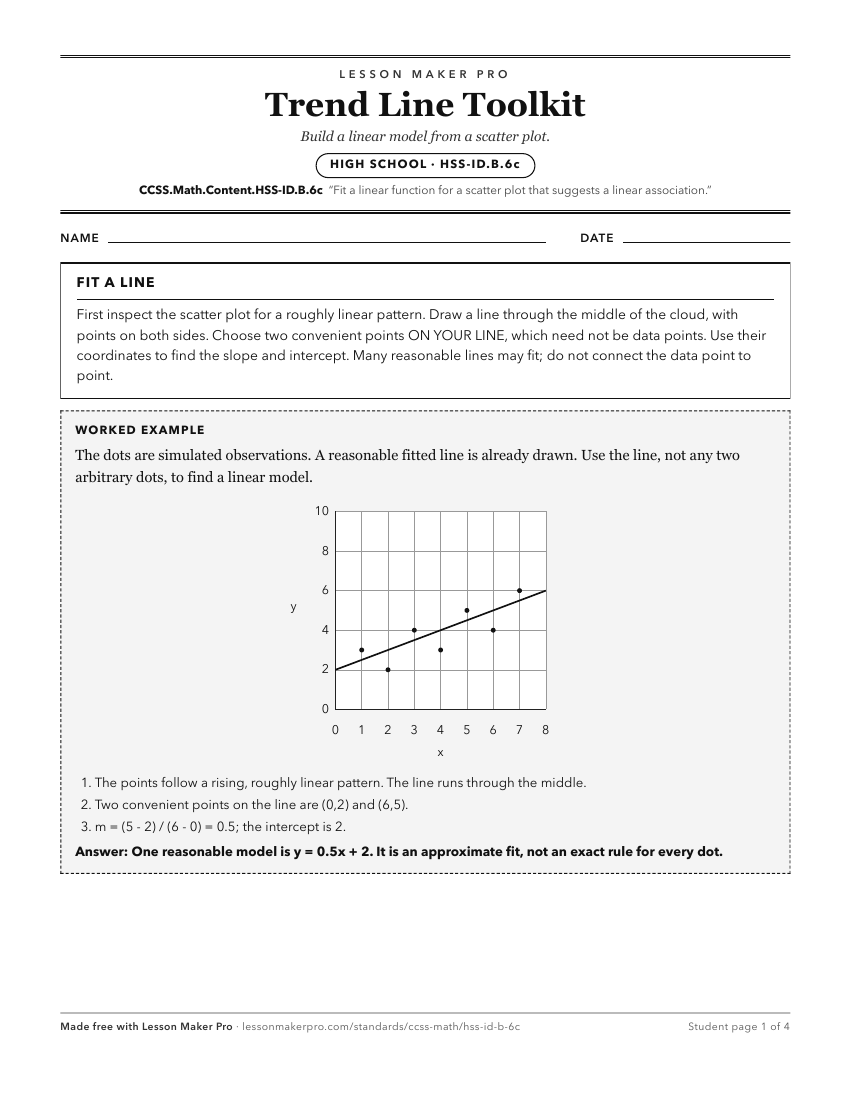
A ready-to-print activity worksheet aligned to CCSS.Math.Content.HSS-ID.B.6c, with an answer key for the teacher on its own page. No account needed.
PDF, US Letter, prints cleanly in black and white.
Download the worksheetLearning progression
Where This Standard Sits
Before This Standard
If students are struggling here, check these first.
- CCSS.Math.Content.8.SP.A.2
Students need to see when a scatter plot is roughly linear and choose a line before writing that line as a function.
- CCSS.Math.Content.8.SP.A.1
Students must read scatter plots and recognize linear association before choosing and fitting an appropriate linear model.
- CCSS.Math.Content.8.F.B.4
Interpreting slope, intercept, and linear models supports fitting a line to data with an apparent linear trend.
What This Unlocks
Mastery here sets students up for these next.
- CCSS.Math.Content.HSS-ID.C.7
Fitting a line to data prepares students to see its slope and intercept as meaningful features of the data context.
- CCSS.Math.Content.HSS-ID.C.8
Choosing a linear model for a scatter plot supports interpreting correlation as the strength and direction of that linear relationship.
Keep exploring
Related Standards
Turn this exact standard into a lesson
Grade, subject, topic, and the complete standard are prefilled. Create one free, no account needed.
Also for this standard:Make a WorksheetMake a QuizMake a Sub Lesson