CCSS.
Standard Cluster
Interpret linear models
Common Core State Standards for Mathematics · High School — Statistics and Probability
Cluster contents
Standards in This Cluster
CCSS.Math.Content.HSS-ID.C is a cluster heading. These are the individual standards under it.
- CCSS.Math.Content.HSS-ID.C.7
Interpret the slope (rate of change) and the intercept (constant term) of a linear model in the context of the data.
- CCSS.Math.Content.HSS-ID.C.8
Compute (using technology) and interpret the correlation coefficient of a linear fit.
- CCSS.Math.Content.HSS-ID.C.9
Distinguish between correlation and causation.
Teacher's field guide
What This Cluster Means
What Students Need to Do
- Students interpret fitted lines for data in context. They explain slope, intercept, direction, and strength, and decide whether a relationship supports correlation or causation.
What Mastery Looks Like
- Students explain the slope and intercept using the variables and units in the situation. They use a scatter plot and correlation coefficient to describe direction and strength, then separate association from causation.
Common Misconceptions
- Students may treat slope as a number without units or assume the intercept always has a useful meaning. They may think a strong correlation proves causation. They may also mistake a negative correlation for a weak relationship.
How to Assess It
- Give students a scatter plot about study time and test scores, its fitted equation, and the correlation coefficient. Ask them to interpret the slope, judge the fit, and explain why causation is not proven.
Lesson moves
Ways to Teach It
Have pairs plot class handspan and height data, fit a line, then label the slope and intercept with units.
Ask students to write whether a strong link between screen time and low grades proves causation, then defend their answer.
Play a matching game with scatter plots, correlation coefficients, fitted equations, and written interpretations.
Use a used-car price model to interpret yearly depreciation, predict a price, and discuss when the model becomes unreasonable.
Free download
Printable HSS-ID.C Worksheet
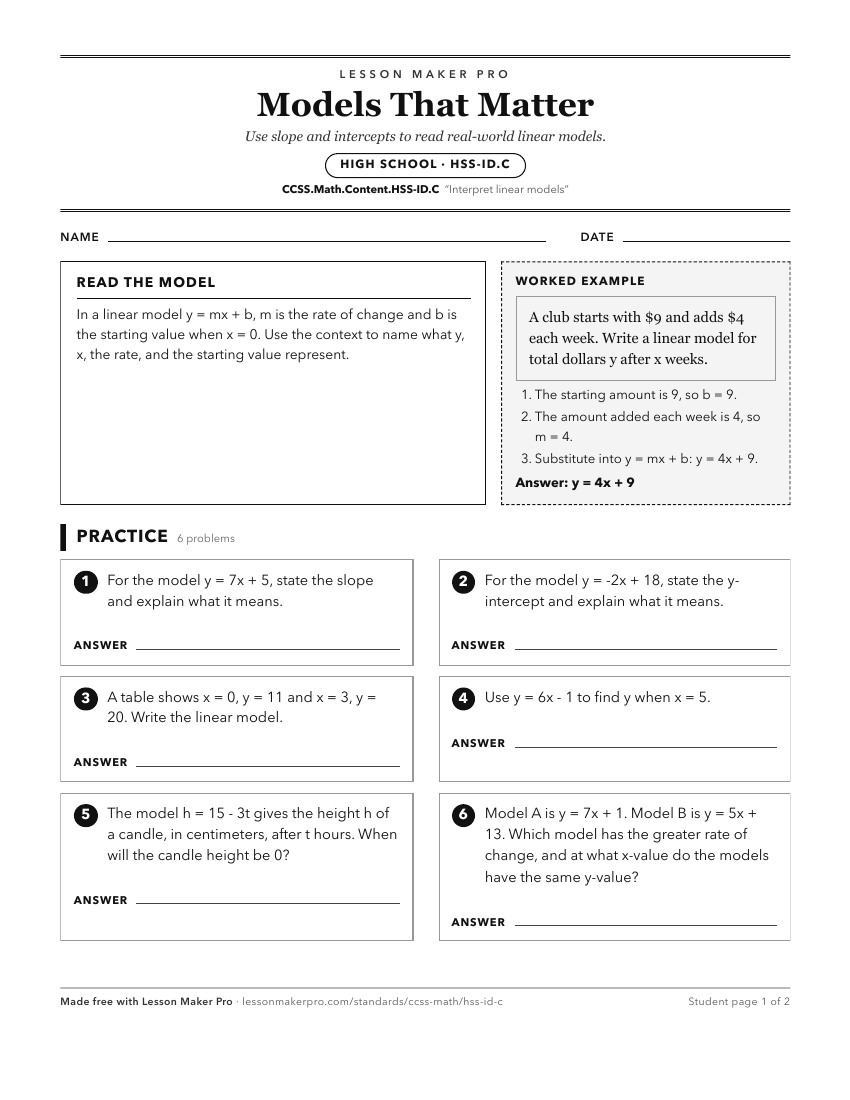
A ready-to-print activity worksheet aligned to CCSS.Math.Content.HSS-ID.C, with an answer key for the teacher on its own page. No account needed.
PDF, US Letter, prints cleanly in black and white.
Download the worksheetKeep exploring
Related Standards
- CCSS.Math.Content.8.SP.A.3
Use the equation of a linear model to solve problems in the context of bivariate measurement data, interpreting the slope and intercept.
- CCSS.Math.Content.HSS-ID.B.6c
Fit a linear function for a scatter plot that suggests a linear association.
- CCSS.Math.Content.HSF-LE.B.5
Interpret the parameters in a linear or exponential function in terms of a context.
Turn this cluster into a lesson
Grade, subject, topic, and the complete cluster are prefilled. Create one free, no account needed.
Also for this cluster:Make a WorksheetMake a QuizMake a Sub Lesson