CCSS.
The Standard
Use the equation of a linear model to solve problems in the context of bivariate measurement data, interpreting the slope and intercept.
Common Core State Standards for Mathematics · Statistics and Probability
Teacher's field guide
What This Standard Means
What Students Need to Do
- Students substitute measured values into a linear model to predict one variable from another. They explain the slope as a rate with units. They explain the intercept at an input of zero and decide whether it makes sense in context.
What Mastery Looks Like
- A student can identify the input and output variables in a model. They interpret the slope and intercept with correct units and context. They use the equation to make a reasonable prediction or find an unknown value.
Common Misconceptions
- Students may treat the slope as a single data value or reverse its units. They may say the intercept is always a starting value, even when an input of zero is outside the data range. Some confuse association with proof that one variable causes the other.
How to Assess It
- Give students this exit ticket: “A candle’s height is modeled by h = 20 - 1.5t. Interpret both numbers and find the height after 6 hours.”
Lesson moves
Ways to Teach It
Stack identical cups, measure each stack, then interpret the slope and intercept in a linear model for cups and stack height.
Ask students to explain when an intercept is meaningful and when it describes a value outside the observed data.
Have pairs match equation cards with scenario cards, slope statements, intercept statements, and predicted values.
Use a phone battery model to predict charge after several hours and explain the battery loss rate in percent per hour.
Free download
Printable 8.SP.A.3 Worksheet
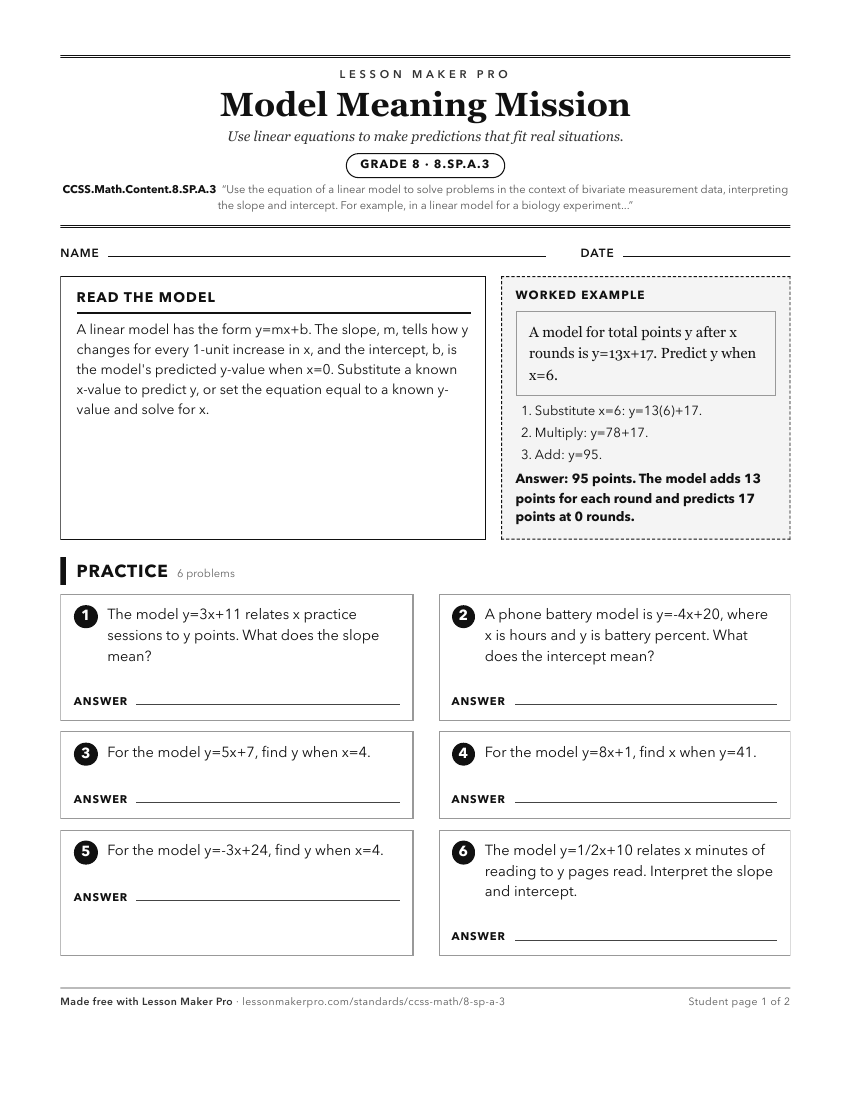
A ready-to-print activity worksheet aligned to CCSS.Math.Content.8.SP.A.3, with an answer key for the teacher on its own page. No account needed.
PDF, US Letter, prints cleanly in black and white.
Download the worksheetLearning progression
Where This Standard Sits
See the whole path on the Statistics & Probability progression map.
Before This Standard
If students are struggling here, check these first.
- CCSS.Math.Content.8.SP.A.2
Informally fitting a line helps students see what the model represents before using its equation, slope, and intercept in context.
- CCSS.Math.Content.8.F.B.4
Solving with linear data models requires knowing slope as rate of change and intercept as initial value in context.
- CCSS.Math.Content.8.SP.A.1
Students use scatter plot patterns and linear association to understand why a linear model fits bivariate data and what it represents.
What This Unlocks
Mastery here sets students up for these next.
- CCSS.Math.Content.HSS-ID.C.7
Grade 8 interpretation of slope and intercept in data contexts directly prepares students to explain those parameters in high school linear models.
- CCSS.Math.Content.HSS-ID.B.6a
Using linear models to interpret and solve contextual data problems supports fitting broader functions to data in high school.
Keep exploring
Related Standards
Turn this exact standard into a lesson
Grade, subject, topic, and the complete standard are prefilled. Create one free, no account needed.
Also for this standard:Make a WorksheetMake a QuizMake a Sub Lesson