CCSS.
Standard Cluster
Construct and compare linear, quadratic, and exponential models and solve problems
Common Core State Standards for Mathematics · High School — Functions
Cluster contents
Standards in This Cluster
CCSS.Math.Content.HSF-LE.A is a cluster heading. These are the individual standards under it.
- CCSS.Math.Content.HSF-LE.A.1
Distinguish between situations that can be modeled with linear functions and with exponential functions.
- CCSS.Math.Content.HSF-LE.A.1a
Prove that linear functions grow by equal differences over equal intervals, and that exponential functions grow by equal factors over equal intervals.
- CCSS.Math.Content.HSF-LE.A.1b
Recognize situations in which one quantity changes at a constant rate per unit interval relative to another.
- CCSS.Math.Content.HSF-LE.A.1c
Recognize situations in which a quantity grows or decays by a constant percent rate per unit interval relative to another.
- CCSS.Math.Content.HSF-LE.A.2
Construct linear and exponential functions, including arithmetic and geometric sequences, given a graph, a description of a relationship, or two input-output pa...
- CCSS.Math.Content.HSF-LE.A.3
Observe using graphs and tables that a quantity increasing exponentially eventually exceeds a quantity increasing linearly, quadratically, or (more generally) a...
- CCSS.Math.Content.HSF-LE.A.4
For exponential models, express as a logarithm the solution to abct = d where a, c, and d are numbers and the base b is 2, 10, or e; evaluate the logarithm usin...
Teacher's field guide
What This Cluster Means
What Students Need to Do
- Students decide whether a situation is best modeled by a linear, quadratic, or exponential function. They build a model from data or context, use it to solve a problem, and compare models using rates of change and key features.
What Mastery Looks Like
- Given a table, graph, or description, students choose an appropriate function type and justify it using differences, second differences, or ratios. They write a matching equation, interpret its parameters, and use it to make and check predictions.
Common Misconceptions
- Students often call any increasing graph exponential or treat repeated percent change as repeated addition. They may miss constant second differences in quadratic data. They also confuse a 20% growth rate with a growth factor of 0.20 instead of 1.20.
How to Assess It
- Give two tables: A has y = 3, 7, 11, 15 and B has y = 3, 6, 12, 24 for x = 0, 1, 2, 3. Ask students to identify and write each model, then decide which is larger at x = 6 and justify.
Lesson moves
Ways to Teach It
Build three growing patterns with tiles: add four each round, add successive odd numbers, and double; record tables and identify each model.
Show three graphs with the same initial value and ask students to write which grows fastest, when, and what graph features support the claim.
Run a card sort matching twelve context, table, graph, and equation cards, then require partners to explain one disputed match.
Model weekly savings, a launched ball's height, and compound interest, then label the linear, quadratic, and exponential features in each result.
Free download
Printable HSF-LE.A Worksheet
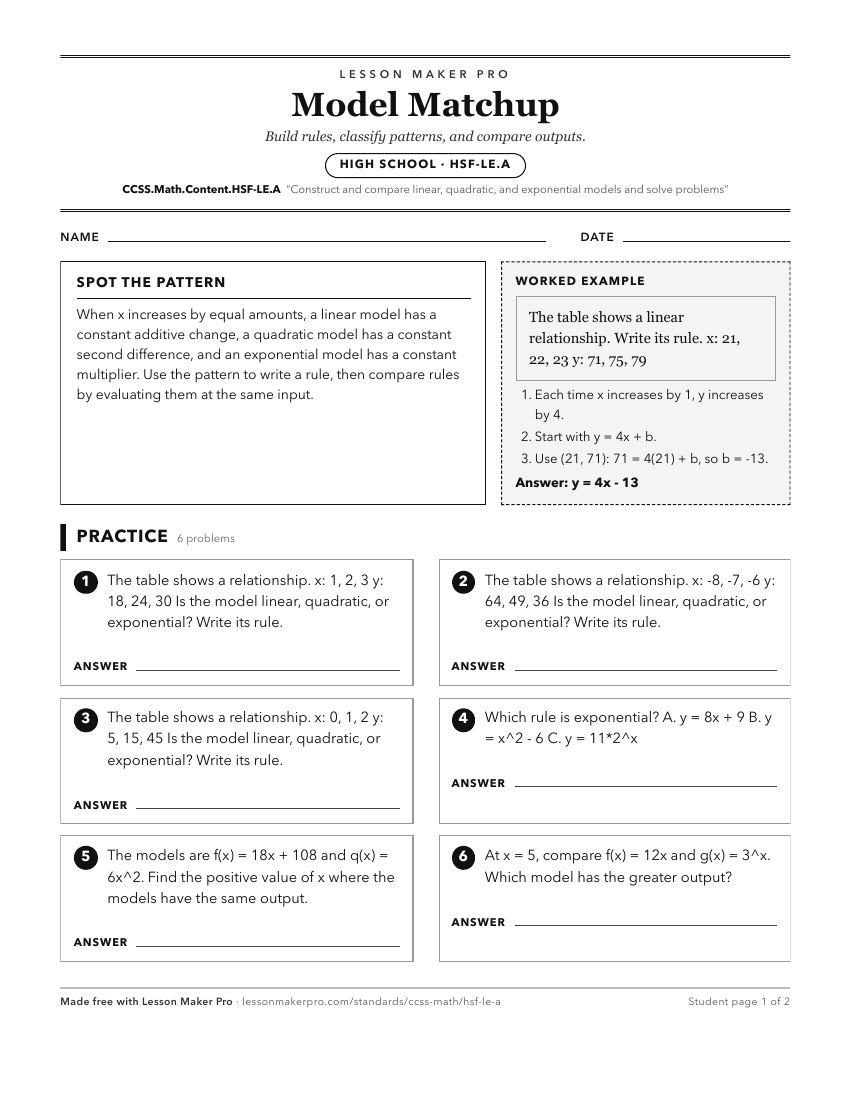
A ready-to-print activity worksheet aligned to CCSS.Math.Content.HSF-LE.A, with an answer key for the teacher on its own page. No account needed.
PDF, US Letter, prints cleanly in black and white.
Download the worksheetKeep exploring
Related Standards
- CCSS.Math.Content.HSA-CED.A.1
Create equations and inequalities in one variable and use them to solve problems. Include equations arising from linear and quadratic functions, and simple rati...
- CCSS.Math.Content.8.EE.C.8c
Solve real-world and mathematical problems leading to two linear equations in two variables.
Turn this cluster into a lesson
Grade, subject, topic, and the complete cluster are prefilled. Create one free, no account needed.
Also for this cluster:Make a WorksheetMake a QuizMake a Sub Lesson