CCSS.
The Standard
Construct and interpret scatter plots for bivariate measurement data to investigate patterns of association between two quantities. Describe patterns such as clustering, outliers, positive or negative association, linear association, and nonlinear association.
Common Core State Standards for Mathematics · Statistics and Probability
Teacher's field guide
What This Standard Means
What Students Need to Do
- Students plot paired measurements as points on a coordinate grid. They describe whether the values rise, fall, curve, or show no clear pattern. They also identify clusters and unusual points.
What Mastery Looks Like
- A student chooses clear scales and plots each data pair accurately. They identify the direction, shape, clusters, and outliers. They support their description with points from the graph.
Common Misconceptions
- Students may reverse the axes or break apart paired values. They may think positive association means all values are positive. They may overlook curved patterns or outliers and claim that association proves causation.
How to Assess It
- Exit ticket: Plot the pairs (10,2), (20,3), (30,4), (40,1), (50,6), and (60,7). Describe the direction and shape, then identify the outlier and explain its effect.
Lesson moves
Ways to Teach It
Have pairs measure hand span and height for ten classmates, then place sticky dots on a large coordinate grid.
Students discuss whether a sleep-hours and reaction-time plot shows a trend, citing two points and naming any cluster or outlier.
Run a card match where students pair six scatter plots with descriptions of positive, negative, linear, nonlinear, clustered, or outlier patterns.
Plot daily temperature against electricity use from a public dataset, then explain the pattern and any unusual days.
Free download
Printable 8.SP.A.1 Worksheet
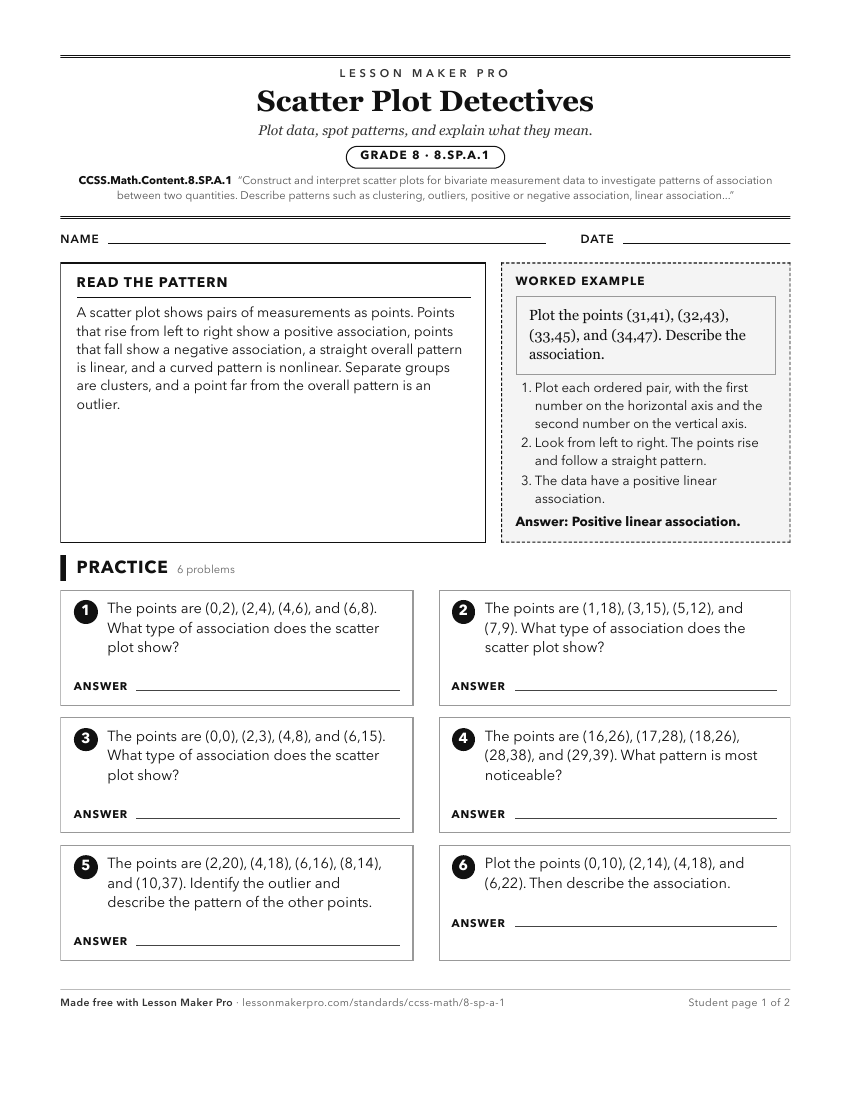
A ready-to-print activity worksheet aligned to CCSS.Math.Content.8.SP.A.1, with an answer key for the teacher on its own page. No account needed.
PDF, US Letter, prints cleanly in black and white.
Download the worksheetLearning progression
Where This Standard Sits
See the whole path on the Statistics & Probability progression map.
Before This Standard
If students are struggling here, check these first.
- CCSS.Math.Content.6.NS.C.8
Plotting coordinate pairs carries over to making scatter plots, while interpretation adds association, clusters, and outliers.
- CCSS.Math.Content.8.F.B.5
Reading graph shape, direction, and linear versus nonlinear patterns supports describing associations and trends in scatter plots.
- CCSS.Math.Content.6.SP.A.2
Seeing data as a distribution supports noticing clusters, outliers, and overall patterns when two measurements are plotted together.
What This Unlocks
Mastery here sets students up for these next.
- CCSS.Math.Content.8.SP.A.2
Students must first read scatter plots and recognize linear association before they can fit and judge a straight-line model.
- CCSS.Math.Content.HSS-ID.B.6
Students must already plot paired quantitative data and recognize association patterns to describe relationships in high school scatter plots.
- CCSS.Math.Content.HSS-ID.B.6c
Students must read scatter plots and recognize linear association before choosing and fitting an appropriate linear model.
- CCSS.Math.Content.8.SP.A.3
Students use scatter plot patterns and linear association to understand why a linear model fits bivariate data and what it represents.
Keep exploring
Related Standards
Turn this exact standard into a lesson
Grade, subject, topic, and the complete standard are prefilled. Create one free, no account needed.
Also for this standard:Make a WorksheetMake a QuizMake a Sub Lesson