CCSS.
Standard Cluster
Investigate patterns of association in bivariate data.
Common Core State Standards for Mathematics
Cluster contents
Standards in This Cluster
CCSS.Math.Content.8.SP.A is a cluster heading. These are the individual standards under it.
- CCSS.Math.Content.8.SP.A.1
Construct and interpret scatter plots for bivariate measurement data to investigate patterns of association between two quantities. Describe patterns such as cl...
- CCSS.Math.Content.8.SP.A.2
Know that straight lines are widely used to model relationships between two quantitative variables. For scatter plots that suggest a linear association, informa...
- CCSS.Math.Content.8.SP.A.3
Use the equation of a linear model to solve problems in the context of bivariate measurement data, interpreting the slope and intercept.
- CCSS.Math.Content.8.SP.A.4
Understand that patterns of association can also be seen in bivariate categorical data by displaying frequencies and relative frequencies in a two-way table. Co...
Teacher's field guide
What This Cluster Means
What Students Need to Do
- Students examine paired numerical or categorical data to find relationships between two variables. They represent data with scatter plots or two-way tables and support claims with patterns, fitted lines, or relative frequencies.
What Mastery Looks Like
- Students create and interpret scatter plots and two-way tables. They describe direction, form, strength, clusters, and outliers, then use a fitted line or relative frequencies to support conclusions.
Common Misconceptions
- Students may treat every scatter plot as linear or assume one unusual point proves there is no association. They may also confuse association with causation or misread frequencies in a two-way table.
How to Assess It
- Give students one scatter plot and one two-way table. Ask them to describe each association, cite numerical or visual evidence, and name one limitation.
Lesson moves
Ways to Teach It
Have students measure hand span and height, plot the class data, then identify direction, clusters, and outliers.
Show a scatter plot and ask, "What claim can you make, and which two features of the graph support it?"
Play Association Sort with cards showing graphs, tables, and descriptions, matching each display to positive, negative, or no association.
Compare school attendance and course grades using anonymous data, then discuss whether the association proves that attendance causes higher grades.
Free download
Printable 8.SP.A Worksheet
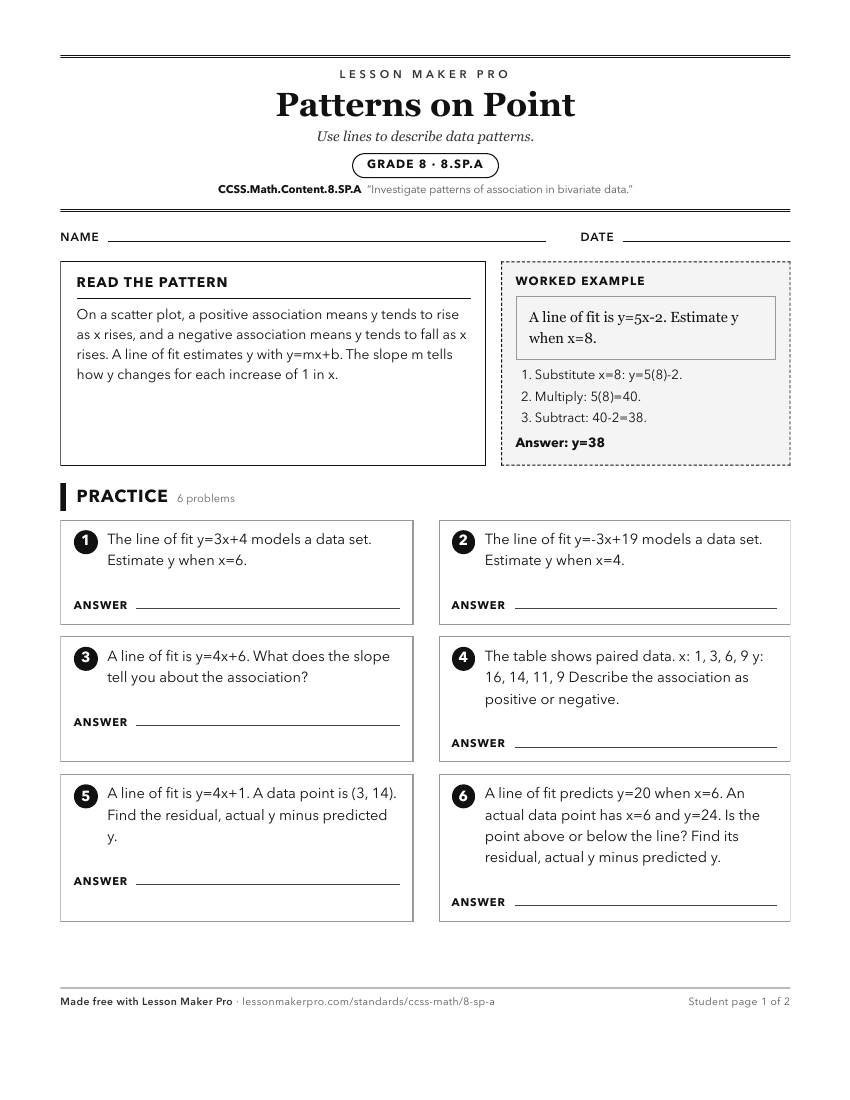
A ready-to-print activity worksheet aligned to CCSS.Math.Content.8.SP.A, with an answer key for the teacher on its own page. No account needed.
PDF, US Letter, prints cleanly in black and white.
Download the worksheetKeep exploring
Related Standards
Turn this cluster into a lesson
Grade, subject, topic, and the complete cluster are prefilled. Create one free, no account needed.
Also for this cluster:Make a WorksheetMake a QuizMake a Sub Lesson