CCSS.
Standard Cluster
Represent and analyze quantitative relationships between dependent and independent variables.
Common Core State Standards for Mathematics
Cluster contents
Standards in This Cluster
CCSS.Math.Content.6.EE.C is a cluster heading. These are the individual standards under it.
Teacher's field guide
What This Cluster Means
What Students Need to Do
- Students identify which quantity is chosen or changed and which quantity responds. They use equations, tables, and graphs to show the relationship and explain what plotted points mean.
What Mastery Looks Like
- Students can identify both variables in a situation and explain how one changes with the other. They can write an equation, complete a table, graph ordered pairs, and interpret points in context.
Common Misconceptions
- Students often reverse the independent and dependent variables or place them on the wrong axes. They may plot ordered pairs backward or describe a pattern without connecting it to the equation.
How to Assess It
- Use this exit ticket: “A dog walker earns $12 per hour. Name both variables, write an equation, make a four-row table, and graph the points.”
Lesson moves
Ways to Teach It
Have pairs add scoops of rice to a cup, record total mass after each scoop, then graph scoop count against mass.
Ask students to explain in writing how hours studied might affect quiz scores and which variable belongs on each axis.
Give groups equation, table, graph, and situation cards to match, then require one spoken justification for each completed set.
Track the cost of movie tickets for different group sizes, then write an equation and graph the relationship.
Free download
Printable 6.EE.C Worksheet
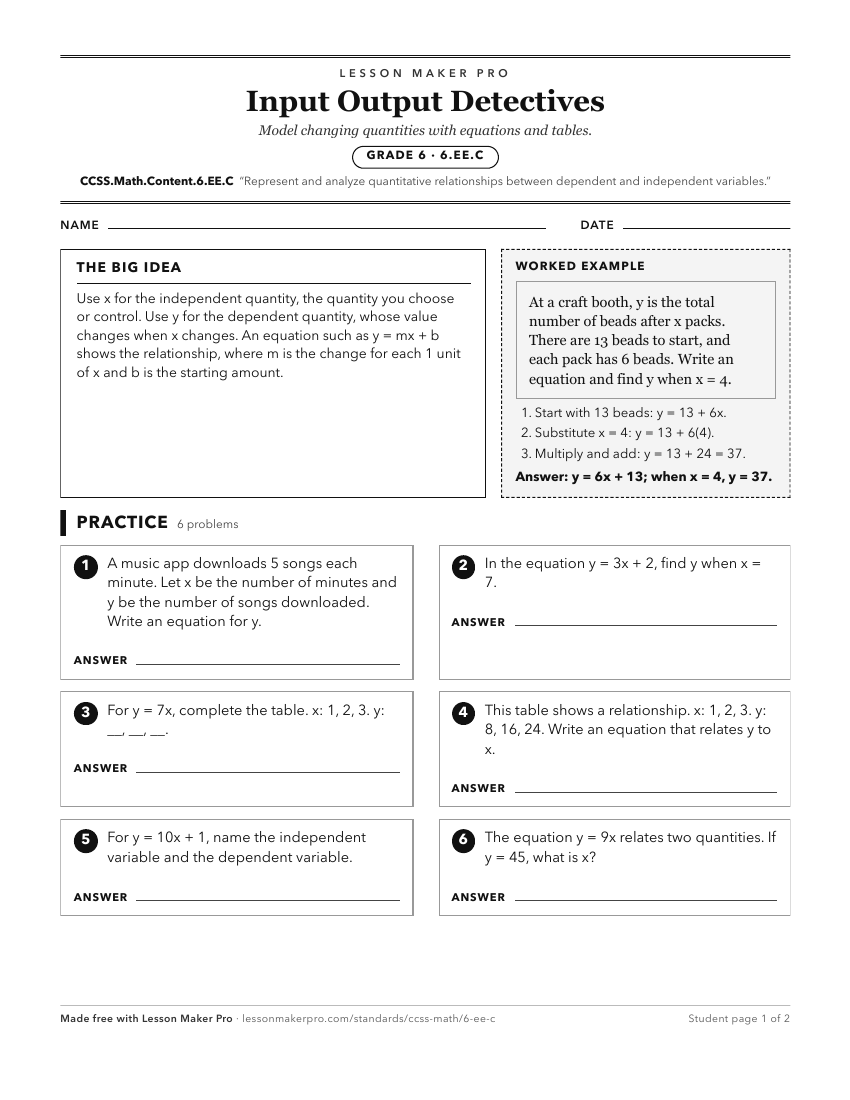
A ready-to-print activity worksheet aligned to CCSS.Math.Content.6.EE.C, with an answer key for the teacher on its own page. No account needed.
PDF, US Letter, prints cleanly in black and white.
Download the worksheetKeep exploring
Related Standards
- CCSS.Math.Content.HSS-ID.B.6
Represent data on two quantitative variables on a scatter plot, and describe how the variables are related.
- CCSS.Math.Content.5.OA.B
Analyze patterns and relationships.
- CCSS.Math.Content.7.RP.A
Analyze proportional relationships and use them to solve real-world and mathematical problems.
Turn this cluster into a lesson
Grade, subject, topic, and the complete cluster are prefilled. Create one free, no account needed.
Also for this cluster:Make a WorksheetMake a QuizMake a Sub Lesson