CCSS.
The Standard
Describe qualitatively the functional relationship between two quantities by analyzing a graph (e.g., where the function is increasing or decreasing, linear or nonlinear). Sketch a graph that exhibits the qualitative features of a function that has been described verbally.
Common Core State Standards for Mathematics · Functions
Teacher's field guide
What This Standard Means
What Students Need to Do
- Students read a graph as a story about how one quantity changes with another. They identify changes in direction and shape, then create a graph from a written description.
What Mastery Looks Like
- Students correctly identify sections where outputs rise, fall, or remain constant as inputs increase. They can tell whether sections are straight or curved and sketch a graph that matches a verbal description.
Common Misconceptions
- Students may confuse a graph rising from left to right with positive y-values. They may also treat every curved graph as decreasing or draw a picture of the situation instead of a coordinate graph.
How to Assess It
- Give an exit ticket with a graph and ask students to label where it rises, falls, or stays flat. Then have them sketch a graph for a quantity that rises quickly, stays constant, and falls slowly.
Lesson moves
Ways to Teach It
Have students walk toward and away from a motion sensor, then label the rising, falling, and flat sections of the resulting graph.
Display a water-level graph and ask, "What might be happening during each section, and what evidence supports your explanation?"
Play Graph Charades by giving teams behavior cards such as rises quickly, stays flat, then falls slowly to sketch for classmates.
Use a daylong temperature graph to connect each change in shape with morning warming, afternoon stability, and evening cooling.
Free download
Printable 8.F.B.5 Worksheet
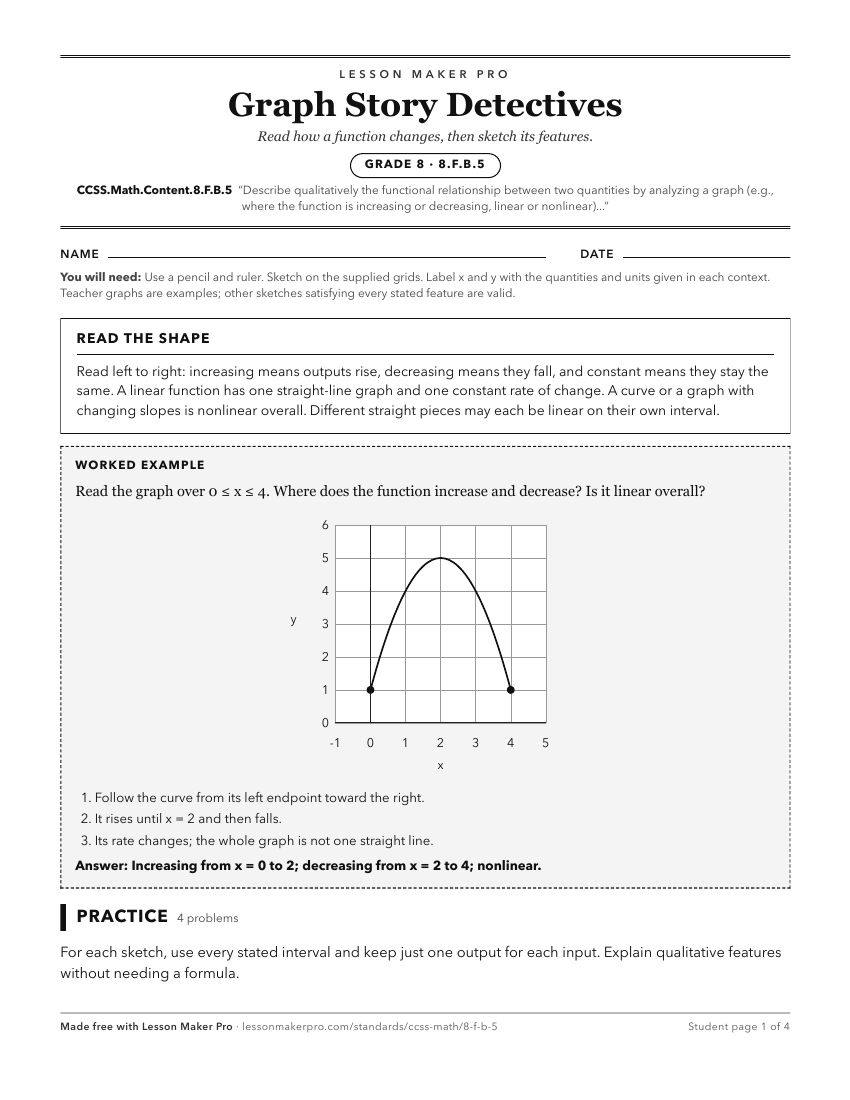
A ready-to-print activity worksheet aligned to CCSS.Math.Content.8.F.B.5, with an answer key for the teacher on its own page. No account needed.
PDF, US Letter, prints cleanly in black and white.
Download the worksheetLearning progression
Where This Standard Sits
Before This Standard
If students are struggling here, check these first.
- CCSS.Math.Content.8.F.A.1
Knowing a function pairs each input with one output supports interpreting graphs as relationships to describe and sketch their features.
- CCSS.Math.Content.6.NS.C.8
Graphing and reading coordinate points supports interpreting and sketching function graphs, though distance calculations are not central.
- CCSS.Math.Content.8.F.A.3
Recognizing straight-line linear functions helps students identify linear and nonlinear regions when describing or sketching graphs.
What This Unlocks
Mastery here sets students up for these next.
- CCSS.Math.Content.HSF-IF.B.4
Interpreting increasing, decreasing, linear, nonlinear, and sketched graph features carries into analyzing contextual function graphs and tables.
- CCSS.Math.Content.8.SP.A.1
Reading graph shape, direction, and linear versus nonlinear patterns supports describing associations and trends in scatter plots.
- CCSS.Math.Content.HSS-ID.B.6
Reading graph shape, direction, and linearity helps students describe patterns and relationships in scatter plots of two variables.
Keep exploring
Related Standards
- CCSS.Math.Content.8.F.A.2
Compare properties of two functions each represented in a different way (algebraically, graphically, numerically in tables, or by verbal descriptions).
- CCSS.Math.Content.HSF-IF.B.5
Relate the domain of a function to its graph and, where applicable, to the quantitative relationship it describes.
- CCSS.Math.Content.8.F.B.4
Construct a function to model a linear relationship between two quantities. Determine the rate of change and initial value of the function from a description of...
Turn this exact standard into a lesson
Grade, subject, topic, and the complete standard are prefilled. Create one free, no account needed.
Also for this standard:Make a WorksheetMake a QuizMake a Sub Lesson