CCSS.
The Standard
Construct a function to model a linear relationship between two quantities. Determine the rate of change and initial value of the function from a description of a relationship or from two (x, y) values, including reading these from a table or from a graph. Interpret the rate of change and initial value of a linear function in terms of the situation it models, and in terms of its graph or a table of values.
Common Core State Standards for Mathematics · Functions
Teacher's field guide
What This Standard Means
What Students Need to Do
- Students build a linear equation from a situation, table, graph, or two coordinate pairs. They find the rate of change and initial value, then explain what each number means in context.
What Mastery Looks Like
- Students can find the rate of change and initial value from a context, table, graph, or two points. They can write the function in the form y = mx + b and explain what m and b mean in the given situation.
Common Misconceptions
- Students may switch the changes in x and y when finding slope, or use one coordinate pair instead of the differences between two pairs. They may also treat the initial value as the first listed value rather than the value when x equals zero.
How to Assess It
- Give students the points (2, 11) and (5, 20) in a taxi fare context. Ask them to write a linear function and explain what its rate of change and initial value mean.
Lesson moves
Ways to Teach It
Give pairs two marked cups and measured water amounts, then have them calculate a fill rate and write a linear function.
Ask students to explain how a graph shows a starting fee and a cost per unit, using evidence from intercepts and points.
Run a slope-intercept match game with cards showing contexts, tables, graphs, equations, rates, and initial values.
Compare two phone plans with different monthly fees and per-gigabyte charges, then write functions and decide when each plan costs less.
Free download
Printable 8.F.B.4 Worksheet
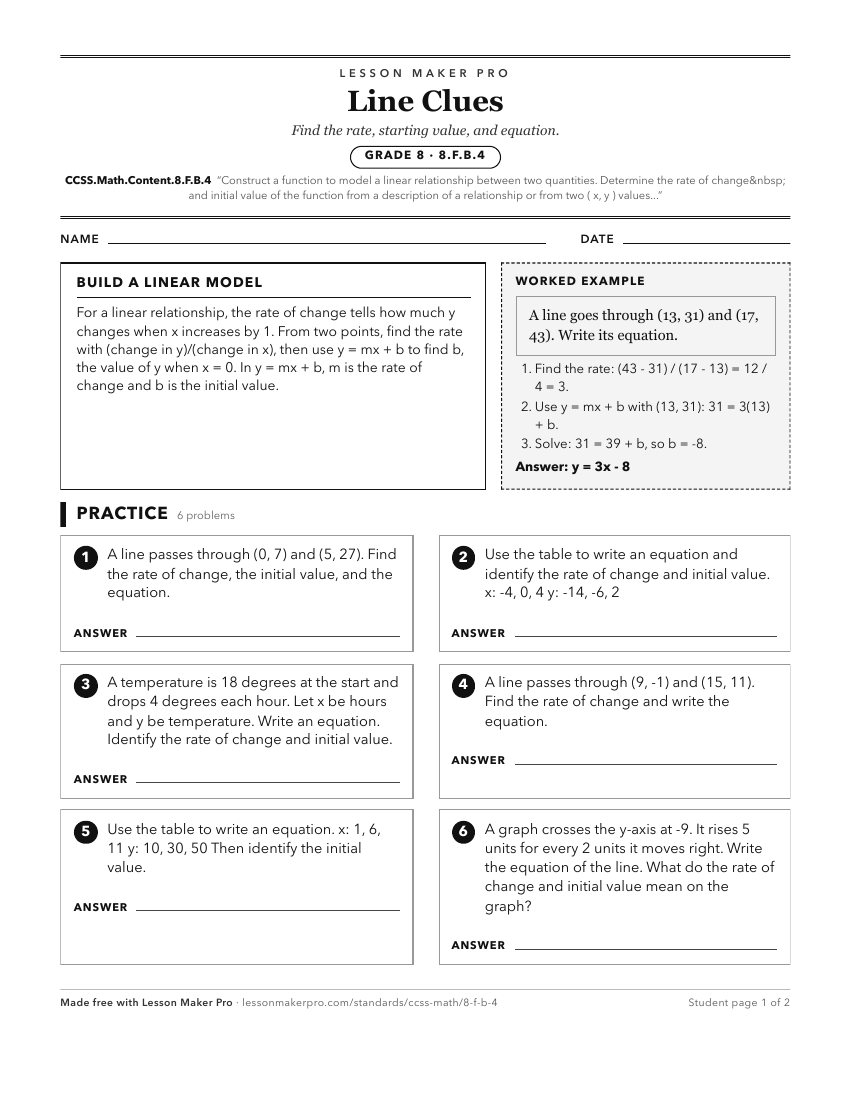
A ready-to-print activity worksheet aligned to CCSS.Math.Content.8.F.B.4, with an answer key for the teacher on its own page. No account needed.
PDF, US Letter, prints cleanly in black and white.
Download the worksheetLearning progression
Where This Standard Sits
Before This Standard
If students are struggling here, check these first.
- CCSS.Math.Content.8.EE.B.6
Understanding constant slope and y-intercept supports finding and interpreting a linear function’s rate of change and initial value.
- CCSS.Math.Content.8.F.A.3
Recognizing y = mx + b and straight-line graphs supports constructing linear models and interpreting slope and intercept from contexts, tables, and graphs.
- CCSS.Math.Content.8.F.A.1
Knowing inputs pair with exactly one output supports using tables, graphs, and rules to model and interpret linear relationships.
What This Unlocks
Mastery here sets students up for these next.
- CCSS.Math.Content.8.SP.A.3
Solving with linear data models requires knowing slope as rate of change and intercept as initial value in context.
- CCSS.Math.Content.HSA-CED.A.2
Constructing linear functions from rates, intercepts, tables, and graphs supports writing and graphing two-variable equations from relationships.
- CCSS.Math.Content.HSS-ID.C.7
Students use rate of change and initial value understanding to interpret slope and intercept in a fitted data model.
- CCSS.Math.Content.HSF-IF.B.6
Linear slope and interpretation prepare students to compute and explain average rate of change over intervals for broader functions.
- CCSS.Math.Content.HSF-LE.A.2
Constructing linear rules from tables, graphs, and contexts carries over directly before adding exponential models and sequences.
- CCSS.Math.Content.HSF-BF.A.1
Constructing linear models from tables, graphs, and contexts supports writing broader functions to describe relationships between quantities.
Keep exploring
Related Standards
- CCSS.Math.Content.HSF-BF.A
Build a function that models a relationship between two quantities
- CCSS.Math.Content.HSF-IF.B.4
For a function that models a relationship between two quantities, interpret key features of graphs and tables in terms of the quantities, and sketch graphs show...
- CCSS.Math.Content.8.F.B.5
Describe qualitatively the functional relationship between two quantities by analyzing a graph (e.g., where the function is increasing or decreasing, linear or ...
Turn this exact standard into a lesson
Grade, subject, topic, and the complete standard are prefilled. Create one free, no account needed.
Also for this standard:Make a WorksheetMake a QuizMake a Sub Lesson