CCSS.
The Standard
Calculate and interpret the average rate of change of a function (presented symbolically or as a table) over a specified interval. Estimate the rate of change from a graph.
Common Core State Standards for Mathematics
Teacher's field guide
What This Standard Means
What Students Need to Do
- Students use two input values and their outputs to find how much the function changes per input unit. They work from formulas, tables, and graphs, then explain what the result means in context.
What Mastery Looks Like
- Students correctly find endpoint values and divide the output difference by the input difference. They explain the result using direction, size, and units, and make a reasonable estimate from a graph.
Common Misconceptions
- Students may divide the output change by the wrong input change or reverse only one subtraction. They may use one endpoint’s value, confuse average change with instantaneous change, or omit units.
How to Assess It
- Exit ticket: For h(t) = -5t² + 20t + 1, use a graph to estimate the average change from t = 0 to 2, then calculate it and interpret the units.
Lesson moves
Ways to Teach It
Roll a toy car down a ramp, record distances at timed intervals, and calculate the average speed for two different intervals.
Ask students to explain how a positive, negative, or zero average change appears in a table and on a graph.
Use a card sort matching equations, tables, graph intervals, and calculated average rates of change.
Compare average temperature changes during two parts of a day using hourly weather data from a local forecast.
Free download
Printable HSF-IF.B.6 Worksheet
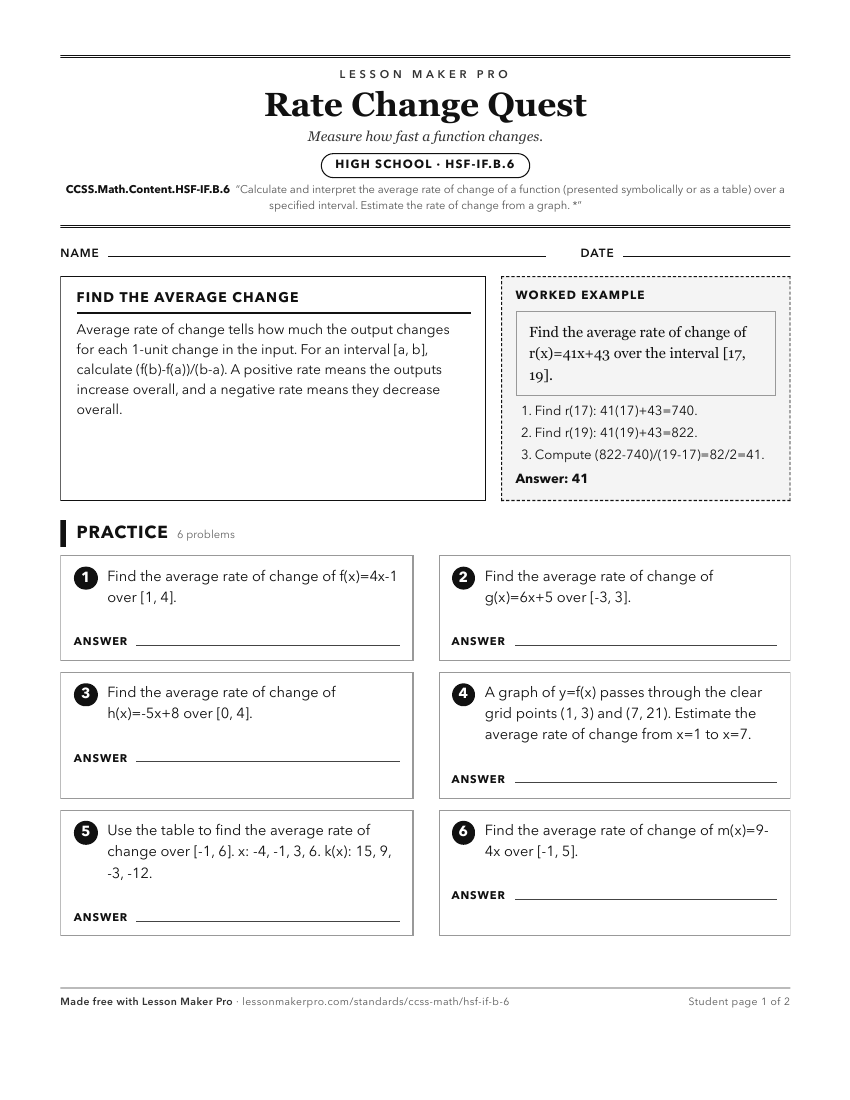
A ready-to-print activity worksheet aligned to CCSS.Math.Content.HSF-IF.B.6, with an answer key for the teacher on its own page. No account needed.
PDF, US Letter, prints cleanly in black and white.
Download the worksheetLearning progression
Where This Standard Sits
Before This Standard
If students are struggling here, check these first.
- CCSS.Math.Content.8.F.B.4
Linear slope and interpretation prepare students to compute and explain average rate of change over intervals for broader functions.
- CCSS.Math.Content.8.F.A.1
Average rate of change compares output changes for two inputs, so students need the input-output view of functions.
- CCSS.Math.Content.8.EE.B.6
Understanding slope between two points and from graphs supports calculating and interpreting average rate of change over intervals.
Keep exploring
Related Standards
- CCSS.Math.Content.HSF-LE.A.1c
Recognize situations in which a quantity grows or decays by a constant percent rate per unit interval relative to another.
- CCSS.Math.Content.HSS-ID.C.7
Interpret the slope (rate of change) and the intercept (constant term) of a linear model in the context of the data.
- CCSS.Math.Content.HSF-LE.A.1b
Recognize situations in which one quantity changes at a constant rate per unit interval relative to another.
Turn this exact standard into a lesson
Grade, subject, topic, and the complete standard are prefilled. Create one free, no account needed.
Also for this standard:Make a WorksheetMake a QuizMake a Sub Lesson