CCSS.
The Standard
Interpret the equation y = mx + b as defining a linear function, whose graph is a straight line; give examples of functions that are not linear.
Common Core State Standards for Mathematics · Functions
Teacher's field guide
What This Standard Means
What Students Need to Do
- Students recognize that a constant rate of change produces points on one straight line. They use an equation, table, or graph to decide whether a function is linear and give examples that are not linear.
What Mastery Looks Like
- A student can graph an equation such as y = -2x + 3 and explain why its points form a straight line. The student can identify a nonlinear function from an equation, table, or graph and support the choice with evidence.
Common Misconceptions
- Students may think every graph made of connected points is linear. They may confuse slope with the starting value or assume any increasing table is linear. Some check only two points, which always form a line, instead of checking all points.
How to Assess It
- Exit ticket: Classify y = 3x - 1, y = x², and the table with x-values 0, 1, 2 and y-values 2, 5, 8. Justify each choice using constant rate of change or graph shape.
Lesson moves
Ways to Teach It
Place coordinate cards for y = 2x + 1 and y = x² on a floor grid, then stretch yarn through each set to test straightness.
Ask students to write why equal increases in x must produce equal changes in y for a linear function.
Play Function Sort with equation, table, and graph cards, matching representations and labeling each set linear or nonlinear.
Compare a taxi fare with a fixed fee and per-mile charge to the area of squares with changing side lengths.
Free download
Printable 8.F.A.3 Worksheet
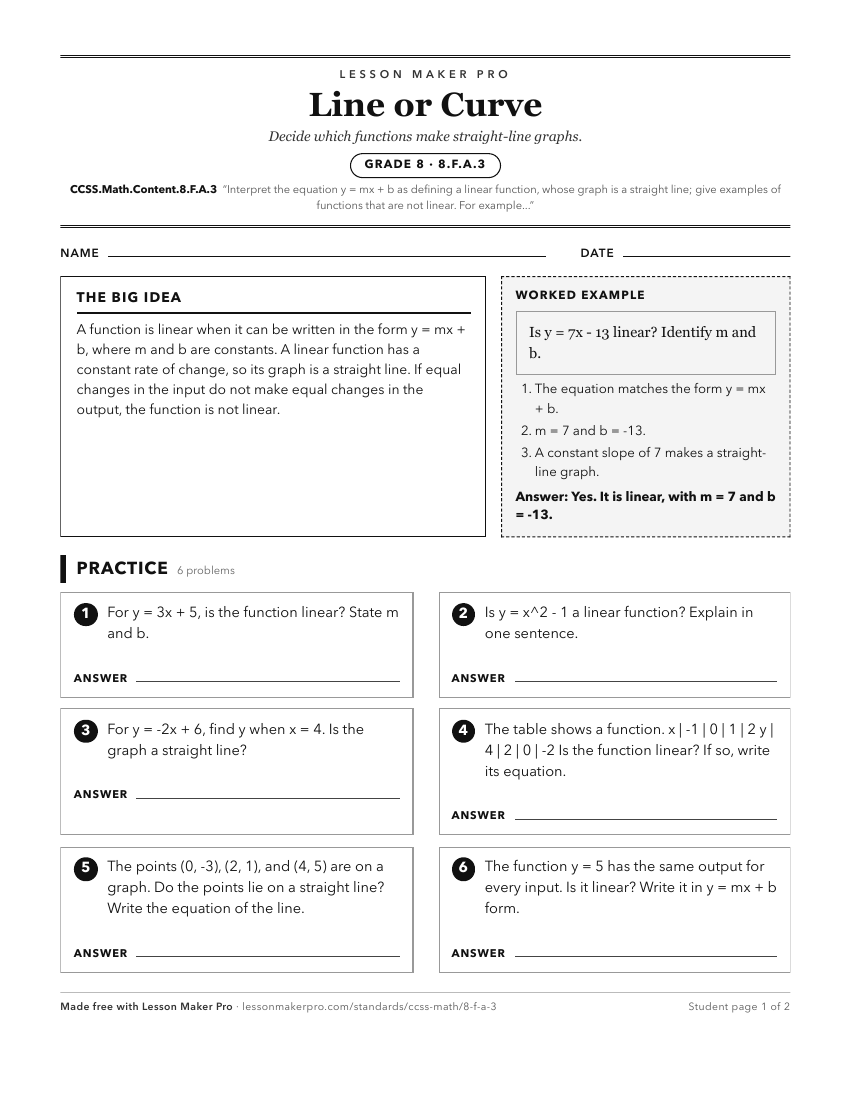
A ready-to-print activity worksheet aligned to CCSS.Math.Content.8.F.A.3, with an answer key for the teacher on its own page. No account needed.
PDF, US Letter, prints cleanly in black and white.
Download the worksheetLearning progression
Where This Standard Sits
Before This Standard
If students are struggling here, check these first.
- CCSS.Math.Content.8.F.A.1
Students must understand inputs, outputs, and function graphs before interpreting y = mx + b as a linear function.
- CCSS.Math.Content.6.NS.C.8
Plotting points on the coordinate plane supports seeing equations as graphs and recognizing a straight-line pattern for linear functions.
- CCSS.Math.Content.8.EE.B.6
Deriving y=mx+b gives students the slope and intercept meaning needed to recognize its graph as a linear function.
What This Unlocks
Mastery here sets students up for these next.
- CCSS.Math.Content.8.EE.C.8a
Recognizing y = mx + b graphs as lines supports seeing two linear equations meet at points satisfying both equations.
- CCSS.Math.Content.8.F.B.4
Recognizing y = mx + b and straight-line graphs supports constructing linear models and interpreting slope and intercept from contexts, tables, and graphs.
- CCSS.Math.Content.HSG-GPE.B.5
Seeing y = mx + b as a line helps students use slope and line equations for parallel and perpendicular criteria.
- CCSS.Math.Content.HSF-LE.A.1a
Knowing linear functions as y = mx + b supports showing slope gives the same output change for equal input intervals.
- CCSS.Math.Content.HSA-REI.D.12
Graphing linear inequalities relies on recognizing the related linear equation as the boundary line before shading the correct half-plane.
- CCSS.Math.Content.HSF-LE.A.1
Recognizing y=mx+b and straight-line graphs supports comparing constant-change linear models with exponential growth or decay situations.
Keep exploring
Related Standards
- CCSS.Math.Content.HSF-IF.C.7a
Graph linear and quadratic functions and show intercepts, maxima, and minima.
- CCSS.Math.Content.8.SP.A.3
Use the equation of a linear model to solve problems in the context of bivariate measurement data, interpreting the slope and intercept.
- CCSS.Math.Content.HSF-LE.A.2
Construct linear and exponential functions, including arithmetic and geometric sequences, given a graph, a description of a relationship, or two input-output pa...
Turn this exact standard into a lesson
Grade, subject, topic, and the complete standard are prefilled. Create one free, no account needed.
Also for this standard:Make a WorksheetMake a QuizMake a Sub Lesson