CCSS.
The Standard
Graph linear and quadratic functions and show intercepts, maxima, and minima.
Common Core State Standards for Mathematics · Analyze functions using different representations
Teacher's field guide
What This Standard Means
What Students Need to Do
- Students create accurate graphs of lines and parabolas from equations. They label both intercepts and use the vertex to identify a parabola's maximum or minimum.
What Mastery Looks Like
- A student chooses a useful scale, plots key points, and draws the correct shape. They give exact coordinates for intercepts and the vertex, then identify a maximum or minimum. They explain that an unrestricted line has neither.
Common Misconceptions
- Students often swap the x- and y-intercepts or forget that an x-intercept has y = 0. They may report only the vertex's x-value or call every vertex a maximum. Sign errors can place intercepts on the wrong side of an axis.
How to Assess It
- Give y = -x + 4 and y = (x - 2)^2 - 9. Ask students to graph both, label all intercepts, identify the quadratic's minimum, and state whether the line has a maximum or minimum.
Lesson moves
Ways to Teach It
Give students graph paper, rulers, and colored stickers to graph two equations, marking intercepts blue and the quadratic vertex red.
Ask students to compare y = (x - 3)^2 - 4 and y = -2(x - 3)^2 + 4, then explain which has a maximum.
Run a card sort matching equations, graphs, intercept cards, and maximum or minimum cards, with partners checking each complete set.
Model a kicked ball with h(t) = -5t^2 + 20t, then interpret both intercepts and the greatest height from its graph.
Free download
Printable HSF-IF.C.7a Worksheet
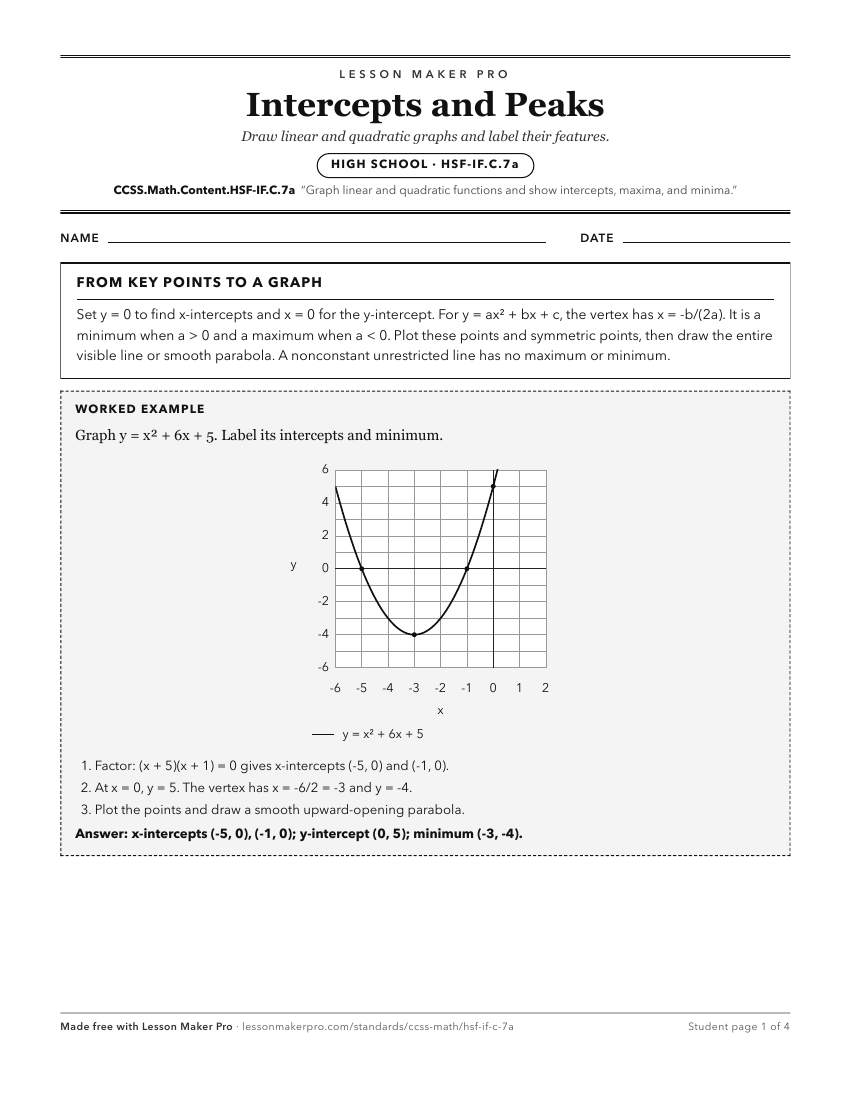
A ready-to-print activity worksheet aligned to CCSS.Math.Content.HSF-IF.C.7a, with an answer key for the teacher on its own page. No account needed.
PDF, US Letter, prints cleanly in black and white.
Download the worksheetLearning progression
Where This Standard Sits
Before This Standard
If students are struggling here, check these first.
- CCSS.Math.Content.HSA-REI.D.10
Students use the idea that plotted points satisfy the equation when finding intercepts and sketching linear or quadratic graphs.
- CCSS.Math.Content.HSF-IF.A.2
Evaluating and interpreting f(x) supports making input-output points and reading graph features like intercepts and extrema.
- CCSS.Math.Content.HSF-IF.A.1
Understanding f(x), inputs, outputs, and y=f(x) supports interpreting linear and quadratic graphs and their intercepts and extrema.
Keep exploring
Related Standards
- CCSS.Math.Content.HSF-IF.C.7e
Graph exponential and logarithmic functions, showing intercepts and end behavior, and trigonometric functions, showing period, midline, and amplitude.
- CCSS.Math.Content.HSA-REI.C.7
Solve a simple system consisting of a linear equation and a quadratic equation in two variables algebraically and graphically.
- CCSS.Math.Content.HSF-LE.A
Construct and compare linear, quadratic, and exponential models and solve problems
- CCSS.Math.Content.HSF-LE.A.2
Construct linear and exponential functions, including arithmetic and geometric sequences, given a graph, a description of a relationship, or two input-output pa...
Turn this exact standard into a lesson
Grade, subject, topic, and the complete standard are prefilled. Create one free, no account needed.
Also for this standard:Make a WorksheetMake a QuizMake a Sub Lesson