CCSS.
The Standard
Graph exponential and logarithmic functions, showing intercepts and end behavior, and trigonometric functions, showing period, midline, and amplitude.
Common Core State Standards for Mathematics · Analyze functions using different representations
Teacher's field guide
What This Standard Means
What Students Need to Do
- Students make accurate graphs of exponential, logarithmic, and trigonometric equations. They locate intercepts, describe end behavior, and identify amplitude, midline, and period when those features apply.
What Mastery Looks Like
- A student can graph each function family with accurate key points and a useful scale. They calculate features from an equation and use those features to check the graph.
Common Misconceptions
- Students may treat logarithmic and exponential graphs as the same shape instead of reflections across y = x. They may confuse an asymptote with an intercept or draw a curve crossing it. For trigonometric graphs, they may use 2π as every period, call the x-axis the midline, or report a negative amplitude.
How to Assess It
- Exit ticket: Graph y = 2^(x − 1) − 2, y = log₂(x + 1), and y = 3cos(2x) − 1 on separate grids. For the first two, label any intercepts and describe end behavior. For the third, label amplitude, midline, and period.
Lesson moves
Ways to Teach It
Have pairs plot y = 2^x and y = log₂x on transparent grids, then reflect one grid across y = x and compare.
Give two sinusoidal graphs and ask, “How do the midline, amplitude, and period prove these graphs are different?”
Run a timed card sort matching equations, graphs, intercepts, asymptotes, end behavior, periods, midlines, and amplitudes.
Match bacteria growth, pH, and Ferris wheel data to exponential, logarithmic, and sinusoidal graphs, then justify each match.
Free download
Printable HSF-IF.C.7e Worksheet
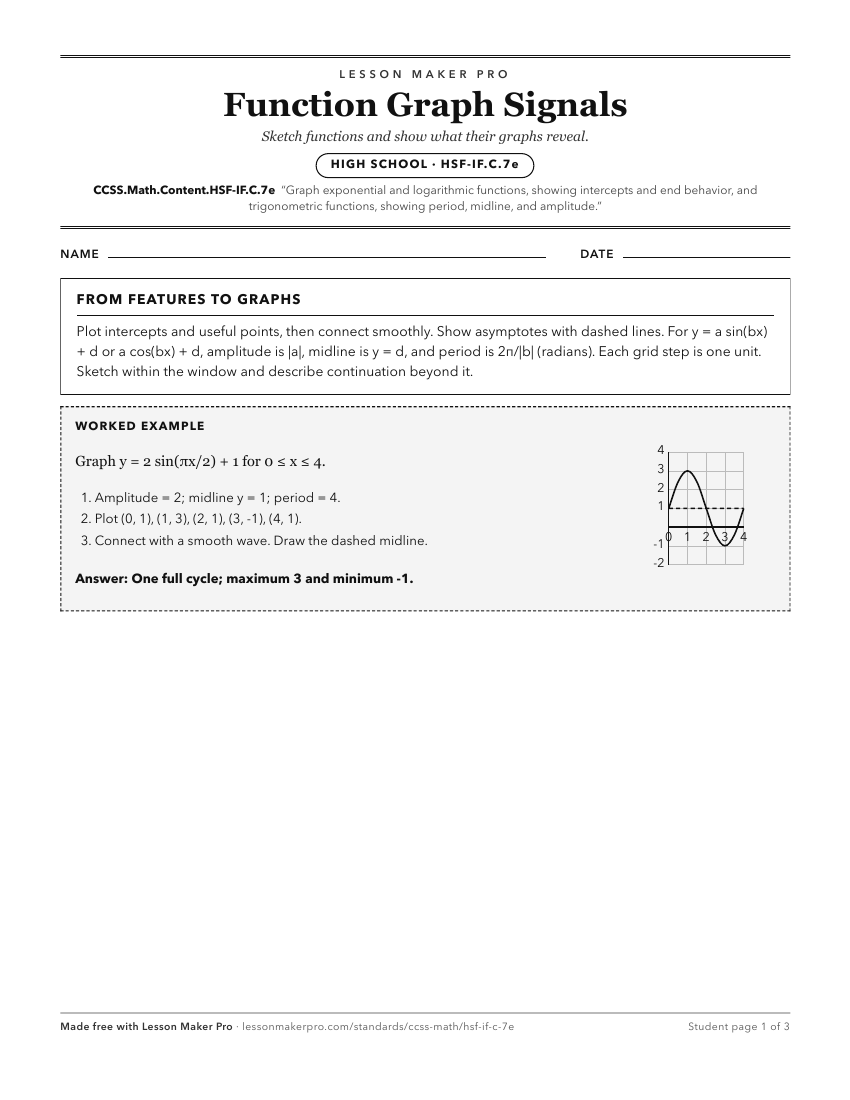
A ready-to-print activity worksheet aligned to CCSS.Math.Content.HSF-IF.C.7e, with an answer key for the teacher on its own page. No account needed.
PDF, US Letter, prints cleanly in black and white.
Download the worksheetLearning progression
Where This Standard Sits
Before This Standard
If students are struggling here, check these first.
- CCSS.Math.Content.HSF-IF.C.7
General graphing from formulas and identifying key features supports the specific exponential, logarithmic, and trigonometric features named in 7e.
- CCSS.Math.Content.HSF-IF.B.4
Interpreting and sketching key graph features supports identifying intercepts, end behavior, period, midline, and amplitude in specific function families.
- CCSS.Math.Content.HSF-TF.A.2
Unit circle understanding supplies all-real inputs and periodic values needed to graph trig functions’ period, midline, and amplitude.
What This Unlocks
Mastery here sets students up for these next.
Keep exploring
Related Standards
- CCSS.Math.Content.HSF-TF.B
Model periodic phenomena with trigonometric functions
- CCSS.Math.Content.HSF-IF.C.7a
Graph linear and quadratic functions and show intercepts, maxima, and minima.
- CCSS.Math.Content.HSF-LE.A.2
Construct linear and exponential functions, including arithmetic and geometric sequences, given a graph, a description of a relationship, or two input-output pa...
Turn this exact standard into a lesson
Grade, subject, topic, and the complete standard are prefilled. Create one free, no account needed.
Also for this standard:Make a WorksheetMake a QuizMake a Sub Lesson