CCSS.
The Standard
Graph functions expressed symbolically and show key features of the graph, by hand in simple cases and using technology for more complicated cases.
Common Core State Standards for Mathematics
Teacher's field guide
What This Standard Means
What Students Need to Do
- Students turn an equation into a graph by hand when the function is simple and use graphing technology when it is not. They locate and label intercepts, extrema, intervals of increase or decrease, symmetry, end behavior, and other relevant features.
What Mastery Looks Like
- Students produce an accurate graph with a useful scale and window. They label key features and use the equation to check that those features make sense.
Common Misconceptions
- Students may confuse zeros with the y-intercept or label any turning point as an absolute maximum or minimum. They may connect across gaps, ignore restricted domains, or accept a misleading calculator window.
How to Assess It
- Give this exit ticket: Graph f(x)=x²−4x−5 by hand. Label both intercepts, the vertex, the axis of symmetry, and the intervals where the function increases and decreases.
Lesson moves
Ways to Teach It
Build a floor graph with tape, plot points for y=|x−2|−1, then mark the vertex, intercepts, and decreasing and increasing intervals.
Compare y=x² and y=(x−3)²−4, then write how each change in the equation moves the graph.
Run a matching relay with equation, graph, and feature cards for linear, quadratic, absolute value, exponential, and rational functions.
Graph h(t)=−16t²+64t+5 for a thrown ball, then identify its starting height, highest point, and landing time.
Free download
Printable HSF-IF.C.7 Worksheet
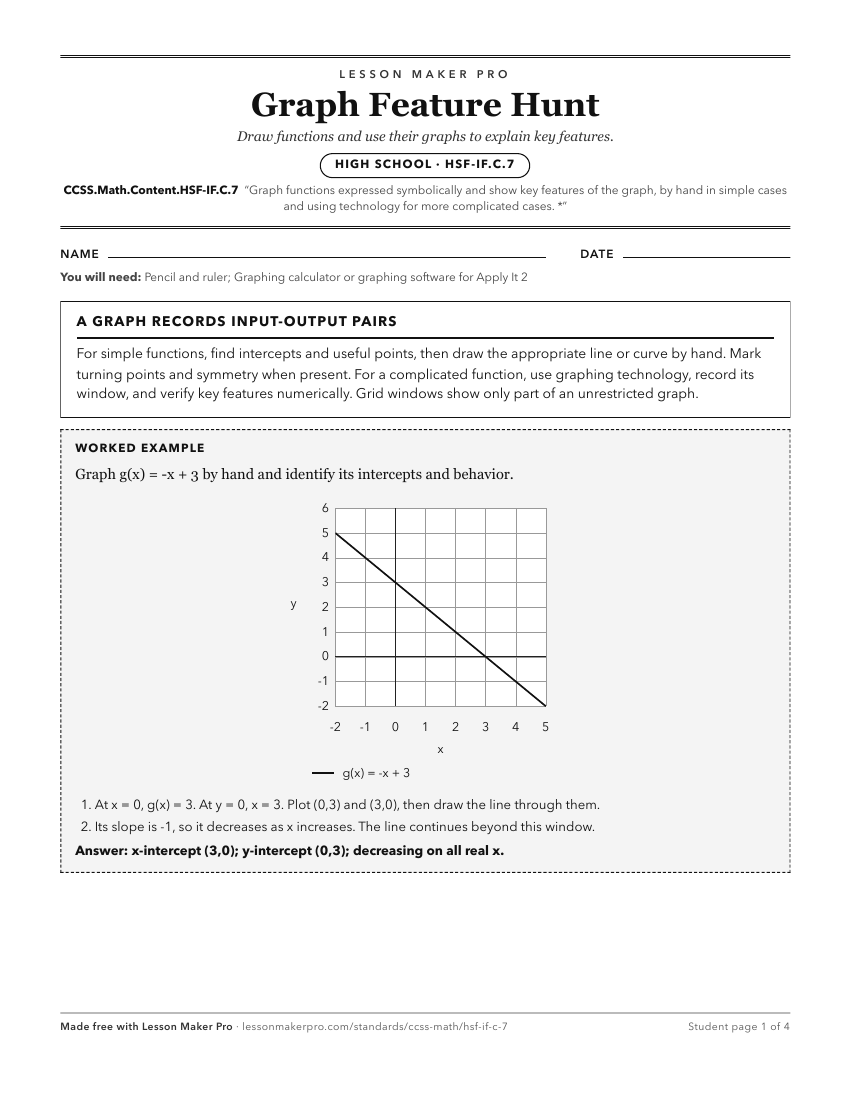
A ready-to-print activity worksheet aligned to CCSS.Math.Content.HSF-IF.C.7, with an answer key for the teacher on its own page. No account needed.
PDF, US Letter, prints cleanly in black and white.
Download the worksheetLearning progression
Where This Standard Sits
Before This Standard
If students are struggling here, check these first.
- CCSS.Math.Content.8.F.A.1
Students must understand inputs, outputs, and graphs as ordered pairs before graphing symbolic functions and interpreting their key features.
- CCSS.Math.Content.HSF-IF.B.4
Interpreting intercepts, intervals, extrema, and end behavior prepares students to identify and display those features when graphing symbolic functions.
- CCSS.Math.Content.HSA-REI.D.10
Graphing symbolic functions relies on treating each point on the graph as an input-output solution to the function equation.
What This Unlocks
Mastery here sets students up for these next.
- CCSS.Math.Content.HSF-IF.C.7e
General graphing from formulas and identifying key features supports the specific exponential, logarithmic, and trigonometric features named in 7e.
- CCSS.Math.Content.HSF-IF.C.7d
Rational-function graphing requires the general skill of turning symbolic rules into graphs and identifying important features.
- CCSS.Math.Content.HSF-BF.B.3
Graphing symbolic functions and reading key features supports seeing how shifts, stretches, and reflections change a function’s graph.
Keep exploring
Related Standards
- CCSS.Math.Content.HSF-IF.C.9
Compare properties of two functions each represented in a different way (algebraically, graphically, numerically in tables, or by verbal descriptions).
- CCSS.Math.Content.8.F.A.2
Compare properties of two functions each represented in a different way (algebraically, graphically, numerically in tables, or by verbal descriptions).
- CCSS.Math.Content.HSF-LE.A.2
Construct linear and exponential functions, including arithmetic and geometric sequences, given a graph, a description of a relationship, or two input-output pa...
Turn this exact standard into a lesson
Grade, subject, topic, and the complete standard are prefilled. Create one free, no account needed.
Also for this standard:Make a WorksheetMake a QuizMake a Sub Lesson