CCSS.
The Standard
For a function that models a relationship between two quantities, interpret key features of graphs and tables in terms of the quantities, and sketch graphs showing key features given a verbal description of the relationship.
Common Core State Standards for Mathematics
Teacher's field guide
What This Standard Means
What Students Need to Do
- Students connect features in graphs and tables to the quantities in a situation. They also sketch reasonable graphs from descriptions, showing where values change direction, cross axes, repeat, or level off.
What Mastery Looks Like
- A student can identify key graph features and explain what each means using the quantities and units. The student can sketch a graph that matches stated starting values, changes, turning points, repeated patterns, and long-run behavior.
Common Misconceptions
- Students often confuse positive output with increasing output. They may report a maximum as only an x-value instead of a point or contextual value. They may claim periodicity from one repeated-looking section or assume every graph starts at the origin.
How to Assess It
- Give this exit ticket: A tank holds 200 liters at 8 a.m., fills to 500 liters by 10, stays full until noon, then empties by 3 p.m. Sketch volume versus time and label the maximum, intercept, and increasing, constant, and decreasing intervals.
Lesson moves
Ways to Teach It
Build floor axes with masking tape; students walk a distance-time story and place cards at intercepts, turning points, and constant intervals.
Show a population graph; students write what each turning point means and when the population is growing or shrinking.
Run a card match with scenario cards, graph cards, and feature cards for intercepts, extrema, symmetry, periodicity, and end behavior.
Use hourly temperature data; students graph it and explain the warmest time, cooling intervals, zero crossings, and whether the pattern may repeat.
Free download
Printable HSF-IF.B.4 Worksheet
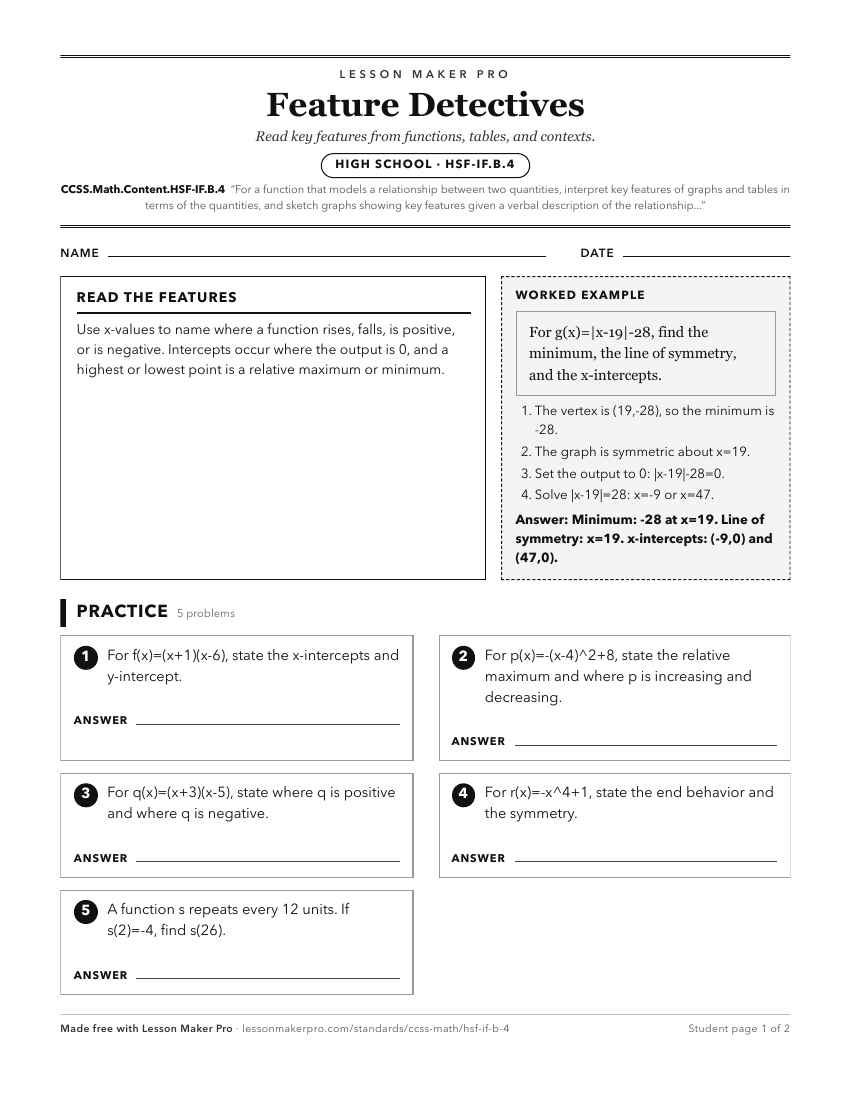
A ready-to-print activity worksheet aligned to CCSS.Math.Content.HSF-IF.B.4, with an answer key for the teacher on its own page. No account needed.
PDF, US Letter, prints cleanly in black and white.
Download the worksheetLearning progression
Where This Standard Sits
Before This Standard
If students are struggling here, check these first.
- CCSS.Math.Content.8.F.A.1
Interpreting function graphs and tables relies on seeing each point as an input-output pair tied to the quantities.
- CCSS.Math.Content.8.F.B.5
Interpreting increasing, decreasing, linear, nonlinear, and sketched graph features carries into analyzing contextual function graphs and tables.
- CCSS.Math.Content.HSF-IF.A.1
Understanding inputs, outputs, function notation, and y=f(x) supports interpreting graph and table features as quantities in a modeled relationship.
What This Unlocks
Mastery here sets students up for these next.
- CCSS.Math.Content.HSF-LE.B.5
Interpreting graph and table features in context supports explaining slope, intercept, growth factor, or initial value as function parameters.
- CCSS.Math.Content.HSF-IF.C.7
Interpreting intercepts, intervals, extrema, and end behavior prepares students to identify and display those features when graphing symbolic functions.
- CCSS.Math.Content.HSF-IF.C.7e
Interpreting and sketching key graph features supports identifying intercepts, end behavior, period, midline, and amplitude in specific function families.
- CCSS.Math.Content.HSF-LE.A.3
Interpreting graphs and tables of modeled functions supports comparing growth patterns and seeing where exponential values overtake polynomial values.
- CCSS.Math.Content.HSA-APR.B.3
Interpreting intercepts and other graph features supports using polynomial zeros as x-intercepts in a rough graph.
- CCSS.Math.Content.HSF-IF.C.9
Interpreting key features in graphs, tables, and descriptions supports comparing those same features across two differently represented functions.
Keep exploring
Related Standards
- CCSS.Math.Content.HSF-BF.A
Build a function that models a relationship between two quantities
- CCSS.Math.Content.8.F.B.4
Construct a function to model a linear relationship between two quantities. Determine the rate of change and initial value of the function from a description of...
- CCSS.Math.Content.8.F.B
Use functions to model relationships between quantities.
Turn this exact standard into a lesson
Grade, subject, topic, and the complete standard are prefilled. Create one free, no account needed.
Also for this standard:Make a WorksheetMake a QuizMake a Sub Lesson