CCSS.
The Standard
Observe using graphs and tables that a quantity increasing exponentially eventually exceeds a quantity increasing linearly, quadratically, or (more generally) as a polynomial function.
Common Core State Standards for Mathematics
Teacher's field guide
What This Standard Means
What Students Need to Do
- Students use tables and graphs to compare how different functions grow as input values increase. They locate when exponential values pass linear or polynomial values and describe why the gap keeps growing.
What Mastery Looks Like
- Students compare values across an extended table or graph and identify where the exponential function overtakes the other function. They explain that later exponential growth continues to outpace linear, quadratic, and other polynomial growth.
Common Misconceptions
- Students may think the function with the greater starting value will always remain greater. They may also compare only the first few rows or treat rapid quadratic growth as exponential growth.
How to Assess It
- Give students tables for f(x) = 20x² and g(x) = 2^x from x = 1 to 15. Ask when g first exceeds f and how the table supports their answer.
Lesson moves
Ways to Teach It
Use linking cubes to model y = 3x and paper squares to record y = 2^x for x-values from 1 through 10.
Ask students to explain why a quadratic graph may look steeper than an exponential graph within a limited viewing window.
Have pairs race to find the first integer x where 2^x exceeds 100x, using calculators and a shared table.
Compare a fixed weekly savings plan with an account growing by a fixed percentage, then identify when the percentage account becomes larger.
Free download
Printable HSF-LE.A.3 Worksheet
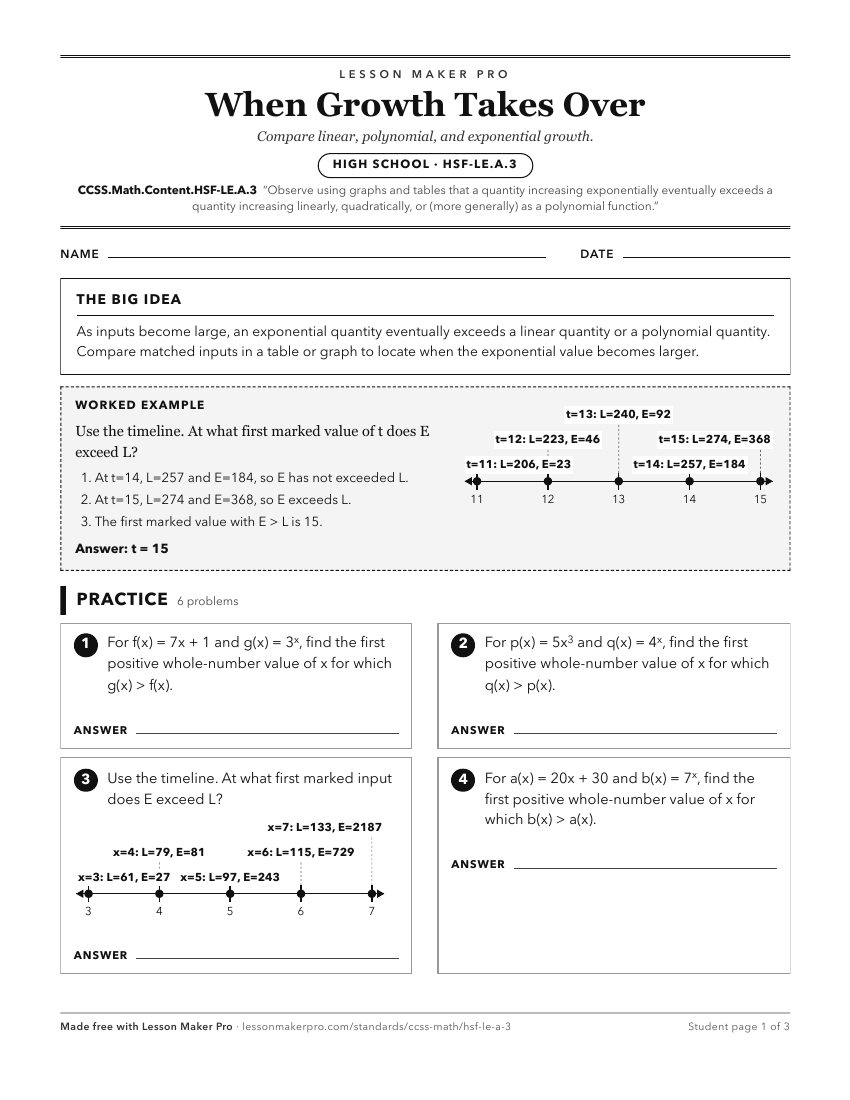
A ready-to-print activity worksheet aligned to CCSS.Math.Content.HSF-LE.A.3, with an answer key for the teacher on its own page. No account needed.
PDF, US Letter, prints cleanly in black and white.
Download the worksheetLearning progression
Where This Standard Sits
Before This Standard
If students are struggling here, check these first.
- CCSS.Math.Content.HSF-LE.A.1a
Recognizing constant differences versus constant factors helps students compare table patterns and see why exponential growth eventually outpaces polynomial growth.
- CCSS.Math.Content.HSF-IF.B.4
Interpreting graphs and tables of modeled functions supports comparing growth patterns and seeing where exponential values overtake polynomial values.
- CCSS.Math.Content.HSF-IF.C.9
Comparing function properties across graphs, tables, and formulas supports noticing exponential growth eventually outpaces linear or polynomial growth.
Keep exploring
Related Standards
- CCSS.Math.Content.HSF-LE.A.1
Distinguish between situations that can be modeled with linear functions and with exponential functions.
- CCSS.Math.Content.8.F.B.5
Describe qualitatively the functional relationship between two quantities by analyzing a graph (e.g., where the function is increasing or decreasing, linear or ...
- CCSS.Math.Content.HSF-LE.A.2
Construct linear and exponential functions, including arithmetic and geometric sequences, given a graph, a description of a relationship, or two input-output pa...
Turn this exact standard into a lesson
Grade, subject, topic, and the complete standard are prefilled. Create one free, no account needed.
Also for this standard:Make a WorksheetMake a QuizMake a Sub Lesson