CCSS.
The Standard
Understand that a set of data collected to answer a statistical question has a distribution which can be described by its center, spread, and overall shape.
Common Core State Standards for Mathematics · Statistics and Probability
Teacher's field guide
What This Standard Means
What Students Need to Do
- Students look at a data set as a whole rather than as separate numbers. They describe where values cluster, how widely they vary, and the pattern formed by the data.
What Mastery Looks Like
- Students can examine a data display and estimate where values cluster, how far they spread, and whether the shape is balanced or uneven. They support each description with values from the data.
Common Misconceptions
- Students may describe only the highest or lowest value instead of the full distribution. They may confuse center with the most frequent value, or ignore gaps, clusters, and unusual values.
How to Assess It
- Give students a dot plot and ask: “Describe its center, spread, and overall shape. Use evidence from the graph.”
Lesson moves
Ways to Teach It
Have groups make a human dot plot using sticky notes showing their shoe sizes, then describe the center, spread, clusters, and gaps.
Show two dot plots and ask, “How are these distributions alike and different in center, spread, and shape?”
Play Distribution Match by having students pair data sets, dot plots, and description cards, then explain each match.
Use daily temperature data from two cities and have students compare typical temperatures, ranges, clusters, gaps, and unusual days.
Free download
Printable 6.SP.A.2 Worksheet
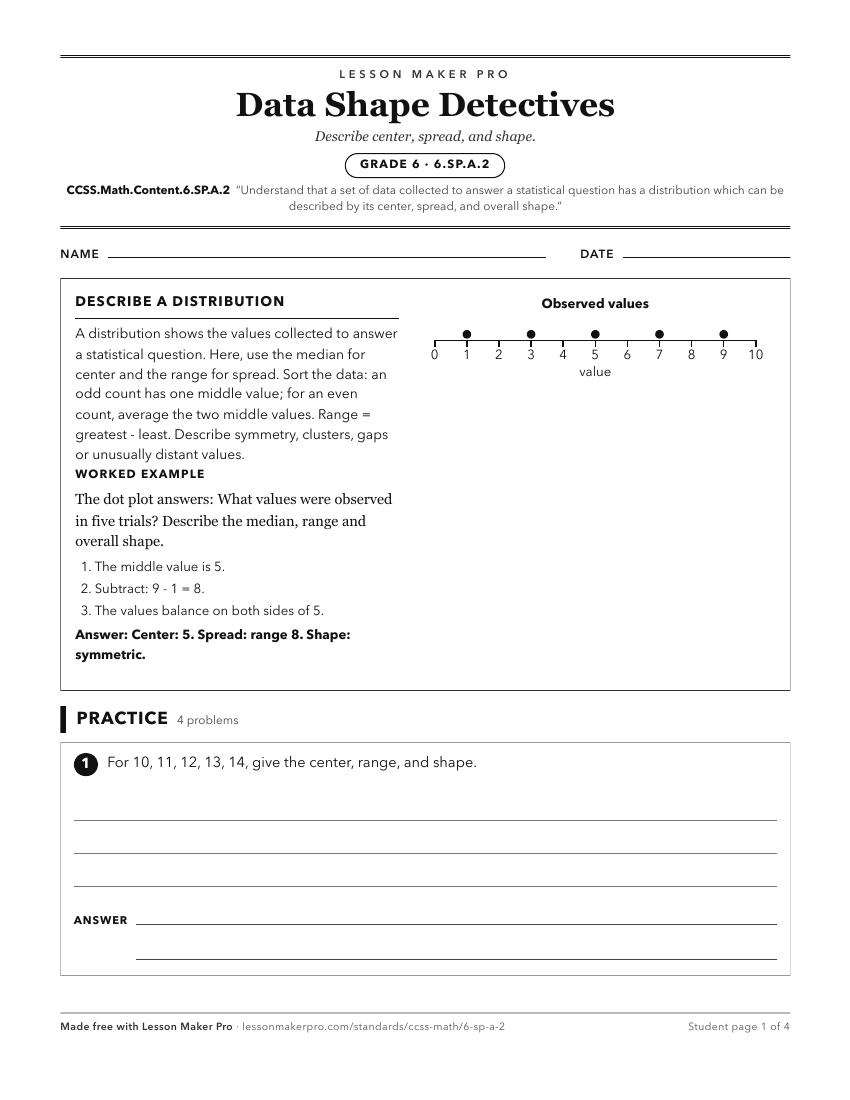
A ready-to-print activity worksheet aligned to CCSS.Math.Content.6.SP.A.2, with an answer key for the teacher on its own page. No account needed.
PDF, US Letter, prints cleanly in black and white.
Download the worksheetLearning progression
Where This Standard Sits
See the whole path on the Statistics & Probability progression map.
Before This Standard
If students are struggling here, check these first.
- CCSS.Math.Content.6.SP.A.1
Recognizing questions that expect variability prepares students to see collected answers as a distribution with center, spread, and shape.
- CCSS.Math.Content.5.MD.B.2
Line plots give students experience seeing measurement data as a distribution before describing its center, spread, and shape.
What This Unlocks
Mastery here sets students up for these next.
- CCSS.Math.Content.6.SP.B.5d
Students must recognize center, spread, and shape before deciding which measures best fit a distribution and its context.
- CCSS.Math.Content.6.SP.B.5c
Knowing distributions are described by center, spread, and shape supports choosing and explaining mean, median, variability, patterns, and outliers.
- CCSS.Math.Content.6.SP.A.3
Seeing a data distribution in terms of center and spread prepares students to interpret single-number summaries for center and variation.
- CCSS.Math.Content.7.SP.B.3
Comparing two distributions by overlap and center difference requires understanding each distribution’s center, spread, and shape.
- CCSS.Math.Content.6.SP.B.5
Understanding distributions by center, spread, and shape is needed to summarize numerical data sets and explain measures in context.
- CCSS.Math.Content.7.SP.A.1
Describing a data distribution by center, spread, and shape helps students see whether a sample can represent a population.
Keep exploring
Related Standards
- CCSS.Math.Content.HSS-ID.A.3
Interpret differences in shape, center, and spread in the context of the data sets, accounting for possible effects of extreme data points (outliers).
- CCSS.Math.Content.HSS-ID.A.2
Use statistics appropriate to the shape of the data distribution to compare center (median, mean) and spread (interquartile range, standard deviation) of two or...
Turn this exact standard into a lesson
Grade, subject, topic, and the complete standard are prefilled. Create one free, no account needed.
Also for this standard:Make a WorksheetMake a QuizMake a Sub Lesson