CCSS.
The Standard
Giving quantitative measures of center (median and/or mean) and variability (interquartile range and/or mean absolute deviation), as well as describing any overall pattern and any striking deviations from the overall pattern with reference to the context in which the data were gathered.
Common Core State Standards for Mathematics
Teacher's field guide
What This Standard Means
What Students Need to Do
- Students calculate a typical value using the mean or median and describe spread using IQR or MAD. They use those values, the distribution's shape, and unusual points to explain what the data show in context.
What Mastery Looks Like
- A student correctly calculates a measure of center and a measure of spread, including correct units. They identify clusters, gaps, skew, or outliers and explain what those features mean for the situation.
Common Misconceptions
- Students may find the median before ordering values or forget to average the two middle values. They may use the full range for IQR or skip absolute values when finding MAD. They may name an outlier without explaining what it means in context.
How to Assess It
- Exit ticket: A bus ride took 10, 12, 12, 14, 17, and 25 minutes over six days. Find the median and IQR, then describe the pattern and any unusual value in context.
Lesson moves
Ways to Teach It
Have students place numbered sticky notes on a floor number line, then mark the median, quartiles, IQR, and any isolated values.
Students write which better represents a set of wait times, mean or median, and support the choice with evidence from the distribution.
Play Data Detective: teams calculate a center and spread measure, then earn points for correctly naming clusters, gaps, skew, and outliers.
Use class backpack weights to summarize a distribution and discuss whether one unusually heavy bag changes the typical value.
Free download
Printable 6.SP.B.5c Worksheet
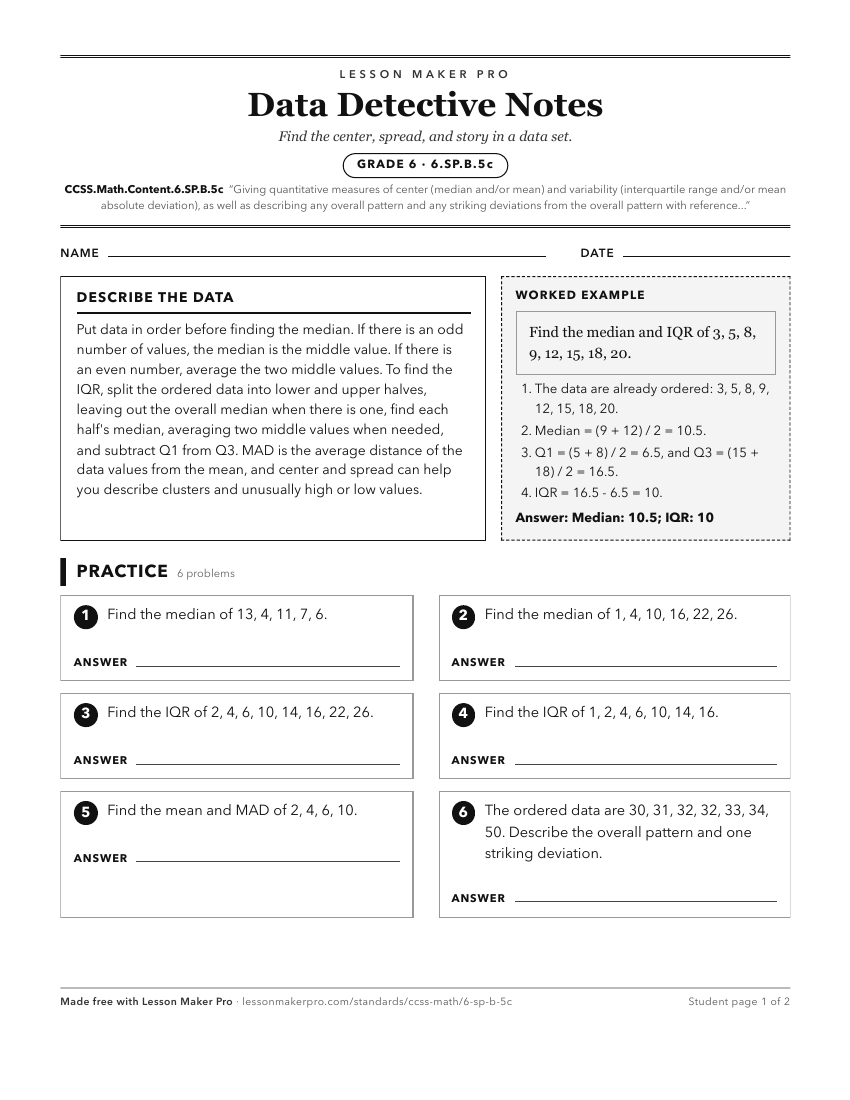
A ready-to-print activity worksheet aligned to CCSS.Math.Content.6.SP.B.5c, with an answer key for the teacher on its own page. No account needed.
PDF, US Letter, prints cleanly in black and white.
Download the worksheetLearning progression
Where This Standard Sits
Before This Standard
If students are struggling here, check these first.
- CCSS.Math.Content.6.SP.A.2
Knowing distributions are described by center, spread, and shape supports choosing and explaining mean, median, variability, patterns, and outliers.
- CCSS.Math.Content.6.SP.A.3
Students must understand center as a summary and variability as spread before choosing and interpreting mean, median, IQR, or MAD.
- CCSS.Math.Content.6.SP.B.4
Displaying data helps students see shape, center, spread, and outliers before describing those features with measures in context.
What This Unlocks
Mastery here sets students up for these next.
- CCSS.Math.Content.7.SP.B.4
Comparing two populations requires using mean or median and variability measures already learned to summarize and interpret numerical data.
- CCSS.Math.Content.6.SP.B.5d
Students must know and describe center, variability, patterns, and outliers before deciding which measures fit a distribution and context.
- CCSS.Math.Content.7.SP.B.3
Comparing two distributions by center difference relative to variability requires knowing how center and variability summarize a distribution.
Keep exploring
Related Standards
Turn this exact standard into a lesson
Grade, subject, topic, and the complete standard are prefilled. Create one free, no account needed.
Also for this standard:Make a WorksheetMake a QuizMake a Sub Lesson