CCSS.
The Standard
Display numerical data in plots on a number line, including dot plots, histograms, and box plots.
Common Core State Standards for Mathematics · Statistics and Probability
Teacher's field guide
What This Standard Means
What Students Need to Do
- Students organize a numerical data set and represent it on an accurately scaled number line. They construct dot plots, histograms, and box plots with correct intervals, frequencies, and summary points.
What Mastery Looks Like
- A student selects a sensible scale and plots every value or frequency accurately. Histogram bars use equal-width intervals and correct heights. Box plots place the minimum, quartiles, median, and maximum at their actual values.
Common Misconceptions
- Students may treat each histogram bar as one value, leave gaps between intervals, or use unequal interval widths. They may place repeated dots side by side instead of stacking them. On box plots, they may space quartiles evenly rather than place them at actual values.
How to Assess It
- Give students the data 1, 2, 2, 3, 4, 5, 6, 7, 8, 8, 9, and assign a dot plot, histogram, or box plot. Check the scale, counts, intervals, and plotted locations.
Lesson moves
Ways to Teach It
Have students measure hand spans, place sticky notes on a floor number line, then copy the class data into a dot plot.
Show one data set as a dot plot and histogram, then ask students what each display makes easier or harder to see.
Run a card sort where groups match data lists to dot plots, histograms, and box plots, then explain one match.
Time cafeteria waits for ten students, then build a histogram using one-minute intervals and discuss the most common wait range.
Free download
Printable 6.SP.B.4 Worksheet
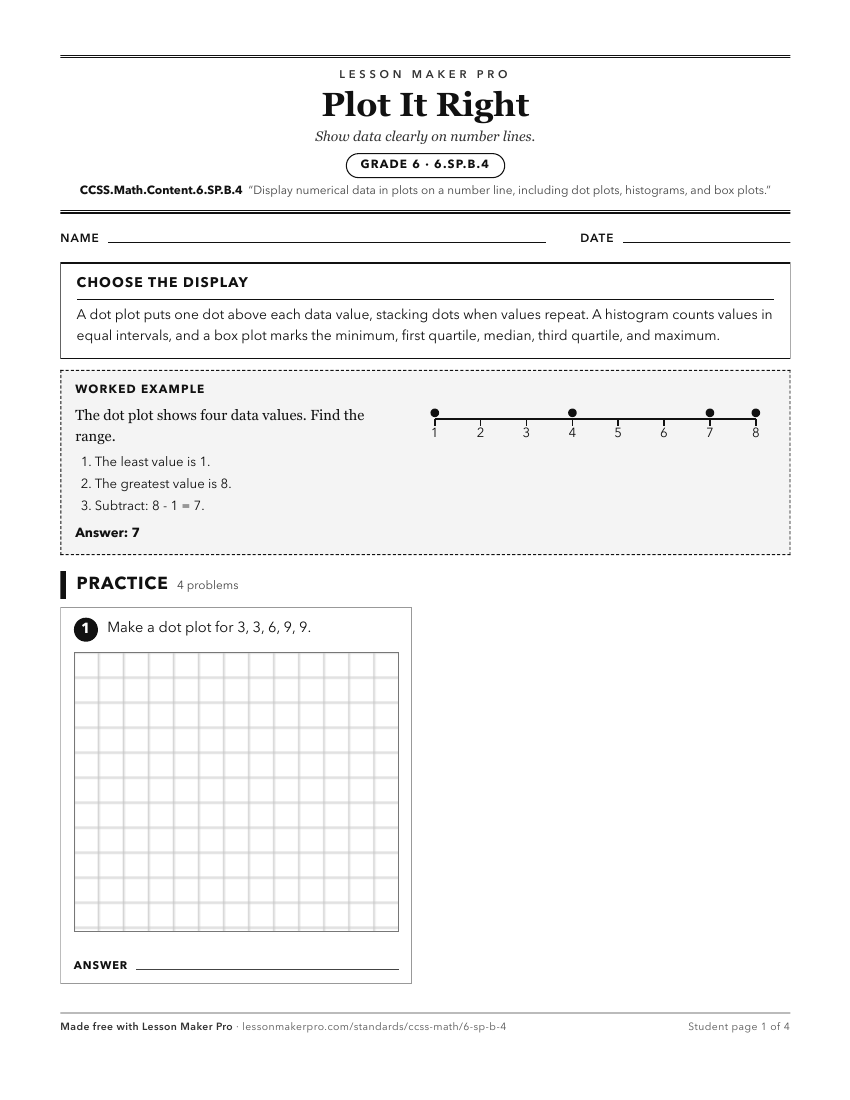
A ready-to-print activity worksheet aligned to CCSS.Math.Content.6.SP.B.4, with an answer key for the teacher on its own page. No account needed.
PDF, US Letter, prints cleanly in black and white.
Download the worksheetLearning progression
Where This Standard Sits
See the whole path on the Statistics & Probability progression map.
Before This Standard
If students are struggling here, check these first.
- CCSS.Math.Content.5.MD.B.2
Making fraction line plots supports placing and reading numerical data on number-line displays before adding histograms and box plots.
- CCSS.Math.Content.6.SP.A.2
Understanding center, spread, and shape helps students choose and interpret dot plots, histograms, and box plots meaningfully.
- CCSS.Math.Content.6.NS.C.6
Placing data values, intervals, and summaries on plots uses the same number line position and scale ideas, including rational values.
What This Unlocks
Mastery here sets students up for these next.
- CCSS.Math.Content.7.SP.B.3
Reading dot plots, histograms, and box plots supports comparing two distributions’ overlap, centers, and spread visually.
- CCSS.Math.Content.6.SP.B.5c
Displaying data helps students see shape, center, spread, and outliers before describing those features with measures in context.
- CCSS.Math.Content.6.SP.B.5
Making dot plots, histograms, and box plots helps students see shape, center, spread, and unusual values they must summarize.
Keep exploring
Related Standards
- CCSS.Math.Content.HSS-ID.A.1
Represent data with plots on the real number line (dot plots, histograms, and box plots).
- CCSS.Math.Content.2.MD.D.9
Generate measurement data by measuring lengths of several objects to the nearest whole unit, or by making repeated measurements of the same object. Show the mea...
- CCSS.Math.Content.4.MD.B.4
Make a line plot to display a data set of measurements in fractions of a unit (1/2, 1/4, 1/8). Solve problems involving addition and subtraction of fractions by...
Turn this exact standard into a lesson
Grade, subject, topic, and the complete standard are prefilled. Create one free, no account needed.
Also for this standard:Make a WorksheetMake a QuizMake a Sub Lesson