CCSS.
The Standard
Make a line plot to display a data set of measurements in fractions of a unit (1/2, 1/4, 1/8). Use operations on fractions for this grade to solve problems involving information presented in line plots.
Common Core State Standards for Mathematics · Measurement and Data
Teacher's field guide
What This Standard Means
What Students Need to Do
- Students organize fractional measurements on a line plot with equal intervals. They read the plot and use fraction operations to find totals, differences, repeated amounts, and equal shares.
What Mastery Looks Like
- Students place fractional values at correctly spaced points and use one X for each measurement. They accurately add, subtract, multiply, or divide the plotted values to answer questions and explain their steps.
Common Misconceptions
- Students may treat each X as a measurement value instead of one item. They may space fractions unevenly, confuse the numerator with the denominator, or divide by the wrong number when finding an equal share.
How to Assess It
- Give students these beaker amounts: 1/2, 3/4, 7/8, and 7/8 cup. Ask them to draw a line plot and find the equal amount after redistribution.
Lesson moves
Ways to Teach It
Have pairs measure six classroom objects to the nearest quarter inch, then build a line plot with sticky notes.
Display a completed line plot and ask, "What can you prove about the data using fraction calculations?"
Play Line Plot Detective by giving teams clue cards about totals, differences, and equal shares to solve from one plot.
Plot ribbon lengths from a craft order, then calculate the total ribbon and how much each student receives when shared equally.
Free download
Printable 5.MD.B.2 Worksheet
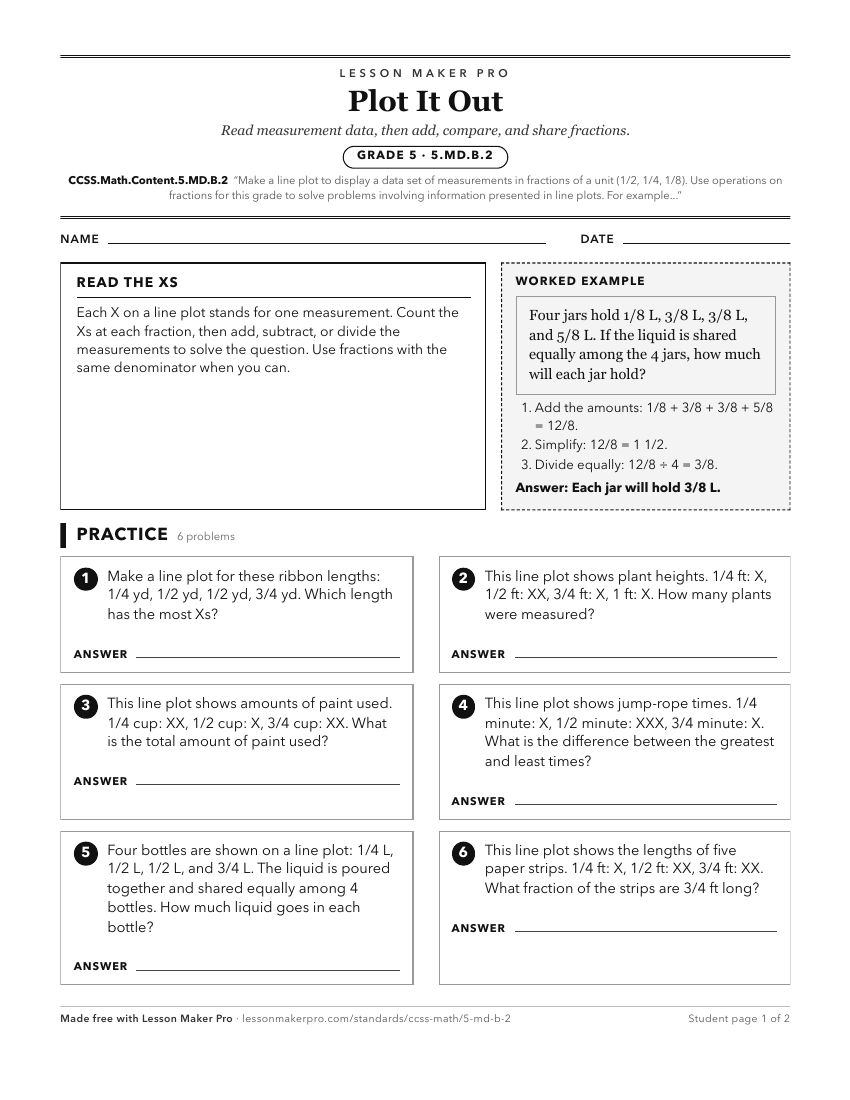
A ready-to-print activity worksheet aligned to CCSS.Math.Content.5.MD.B.2, with an answer key for the teacher on its own page. No account needed.
PDF, US Letter, prints cleanly in black and white.
Download the worksheetLearning progression
Where This Standard Sits
See the whole path on the Measurement & Data progression map.
Before This Standard
If students are struggling here, check these first.
- CCSS.Math.Content.4.MD.B.4
Grade 5 line plots extend the same fractional measurement displays from fraction addition and subtraction to broader fraction operations.
- CCSS.Math.Content.5.NF.A.1
Line plot questions often require adding or subtracting fractional measurements, including converting halves, fourths, and eighths to common denominators.
- CCSS.Math.Content.5.NF.A.2
Adding and subtracting fractions carries over when students compare, combine, or find differences in fractional measurements on line plots.
What This Unlocks
Mastery here sets students up for these next.
- CCSS.Math.Content.6.SP.B.4
Making fraction line plots supports placing and reading numerical data on number-line displays before adding histograms and box plots.
- CCSS.Math.Content.6.SP.A.2
Line plots give students experience seeing measurement data as a distribution before describing its center, spread, and shape.
- CCSS.Math.Content.6.SP.A.3
Line plots give practice viewing numerical data as a distribution, which supports understanding one-number summaries of center and spread.
Keep exploring
Related Standards
- CCSS.Math.Content.3.NF.A.2
Understand a fraction as a number on the number line; represent fractions on a number line diagram.
- CCSS.Math.Content.3.MD.B.4
Generate measurement data by measuring lengths using rulers marked with halves and fourths of an inch. Show the data by making a line plot, where the horizontal...
- CCSS.Math.Content.2.MD.D.9
Generate measurement data by measuring lengths of several objects to the nearest whole unit, or by making repeated measurements of the same object. Show the mea...
Turn this exact standard into a lesson
Grade, subject, topic, and the complete standard are prefilled. Create one free, no account needed.
Also for this standard:Make a WorksheetMake a QuizMake a Sub Lesson