CCSS.
The Standard
Recognize that a measure of center for a numerical data set summarizes all of its values with a single number, while a measure of variation describes how its values vary with a single number.
Common Core State Standards for Mathematics · Statistics and Probability
Teacher's field guide
What This Standard Means
What Students Need to Do
- Students describe what the mean or median reveals about a data set and what the range or another spread measure reveals. They explain why both are needed.
What Mastery Looks Like
- Students can identify or calculate a center and a spread for a data set. They can explain how two sets with the same center may differ in variation.
Common Misconceptions
- Students may treat the center as the midpoint between the least and greatest values. They may think equal means imply identical data sets, or that a larger range means a larger typical value.
How to Assess It
- Give Set A: 4, 5, 6 and Set B: 0, 5, 10. Ask students to find each median and range, then explain what each measure shows.
Lesson moves
Ways to Teach It
Use linking-cube towers to build two data sets with the same mean but different ranges, then compare their shapes.
Show two sets with the same median and ask, "How are these data sets alike, and how are they different?"
Have pairs sort data cards under labels such as same center, different spread, then justify each placement.
Compare weekly temperatures for two cities with similar averages but different ranges, then decide what clothing each trip requires.
Free download
Printable 6.SP.A.3 Worksheet
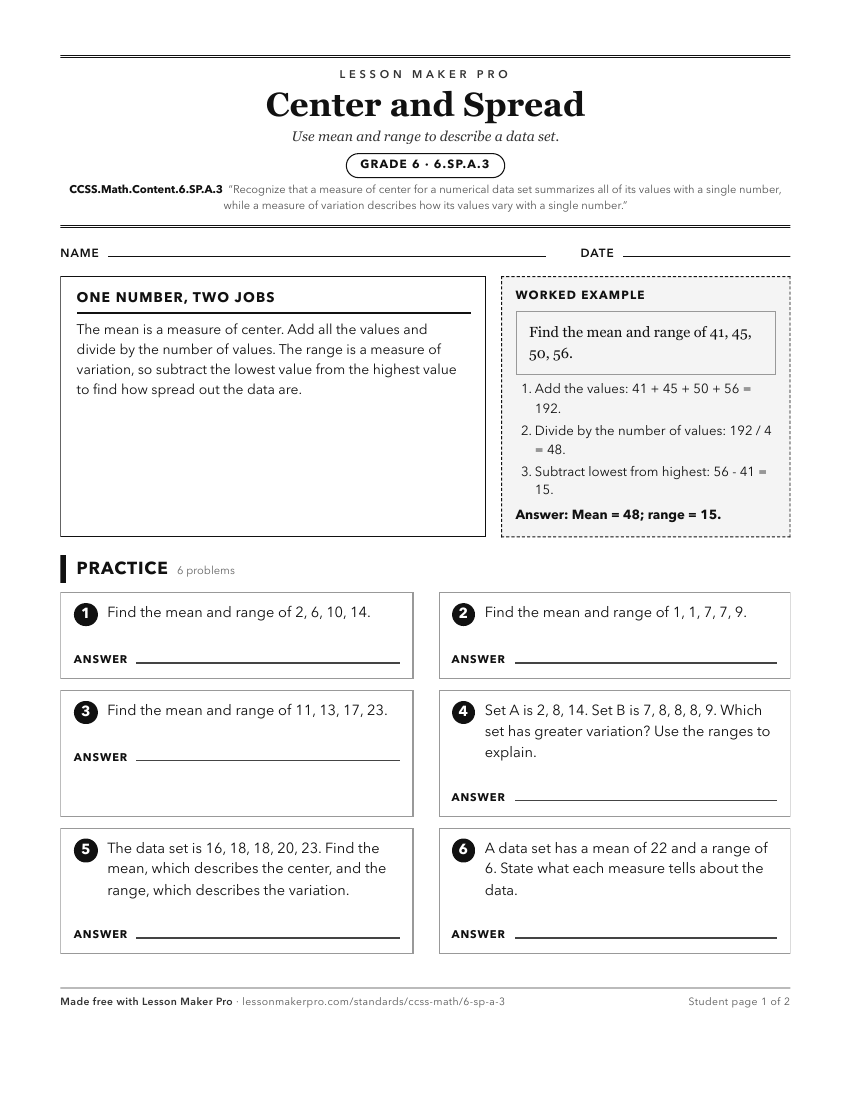
A ready-to-print activity worksheet aligned to CCSS.Math.Content.6.SP.A.3, with an answer key for the teacher on its own page. No account needed.
PDF, US Letter, prints cleanly in black and white.
Download the worksheetLearning progression
Where This Standard Sits
See the whole path on the Statistics & Probability progression map.
Before This Standard
If students are struggling here, check these first.
- CCSS.Math.Content.6.SP.A.2
Seeing a data distribution in terms of center and spread prepares students to interpret single-number summaries for center and variation.
- CCSS.Math.Content.6.SP.A.1
Recognizing that data vary prepares students to see why data sets need both a typical value and a variation summary.
- CCSS.Math.Content.5.MD.B.2
Line plots give practice viewing numerical data as a distribution, which supports understanding one-number summaries of center and spread.
What This Unlocks
Mastery here sets students up for these next.
- CCSS.Math.Content.6.SP.B.5d
Choosing measures for a distribution requires knowing that center summarizes typical value and variability summarizes spread.
- CCSS.Math.Content.6.SP.B.5c
Students must understand center as a summary and variability as spread before choosing and interpreting mean, median, IQR, or MAD.
- CCSS.Math.Content.6.SP.B.5
Understanding center and variation supports choosing and explaining statistics when summarizing a data set in context.
Keep exploring
Related Standards
- CCSS.Math.Content.7.SP.B.4
Use measures of center and measures of variability for numerical data from random samples to draw informal comparative inferences about two populations.
- CCSS.Math.Content.7.SP.B.3
Informally assess the degree of visual overlap of two numerical data distributions with similar variabilities, measuring the difference between the centers by e...
Turn this exact standard into a lesson
Grade, subject, topic, and the complete standard are prefilled. Create one free, no account needed.
Also for this standard:Make a WorksheetMake a QuizMake a Sub Lesson