CCSS.
The Standard
Use measures of center and measures of variability for numerical data from random samples to draw informal comparative inferences about two populations.
Common Core State Standards for Mathematics · Statistics and Probability
Teacher's field guide
What This Standard Means
What Students Need to Do
- Students calculate and compare a measure of center and a measure of variability for two random samples. They use both results to make a reasonable claim about the populations.
What Mastery Looks Like
- A student can report that one sample's median is 6 units higher while its IQR is similar. They can explain whether the difference is large compared with the spread and make a cautious population claim.
Common Misconceptions
- Students often compare means alone and ignore wide spread or strong overlap. They may confuse IQR with range, or assume one random sample proves every member of one population is larger.
How to Assess It
- Exit ticket: Random sample A has a median of 18 and IQR of 4. Sample B has a median of 12 and IQR of 5. Which population likely has larger values, and how do both statistics support your answer?
Lesson moves
Ways to Teach It
Place two sets of numbered cards in bags. Groups draw random samples, calculate medians and IQRs, then compare the hidden populations.
Write and defend a claim: Does a six-point difference in medians matter when both samples have IQRs of twenty points?
Play Sample Showdown: Pairs receive two data cards and earn a point for a justified comparison using center and variability.
Compare random samples of commute times for bus riders and car riders, then advise which group usually has shorter, more consistent trips.
Free download
Printable 7.SP.B.4 Worksheet
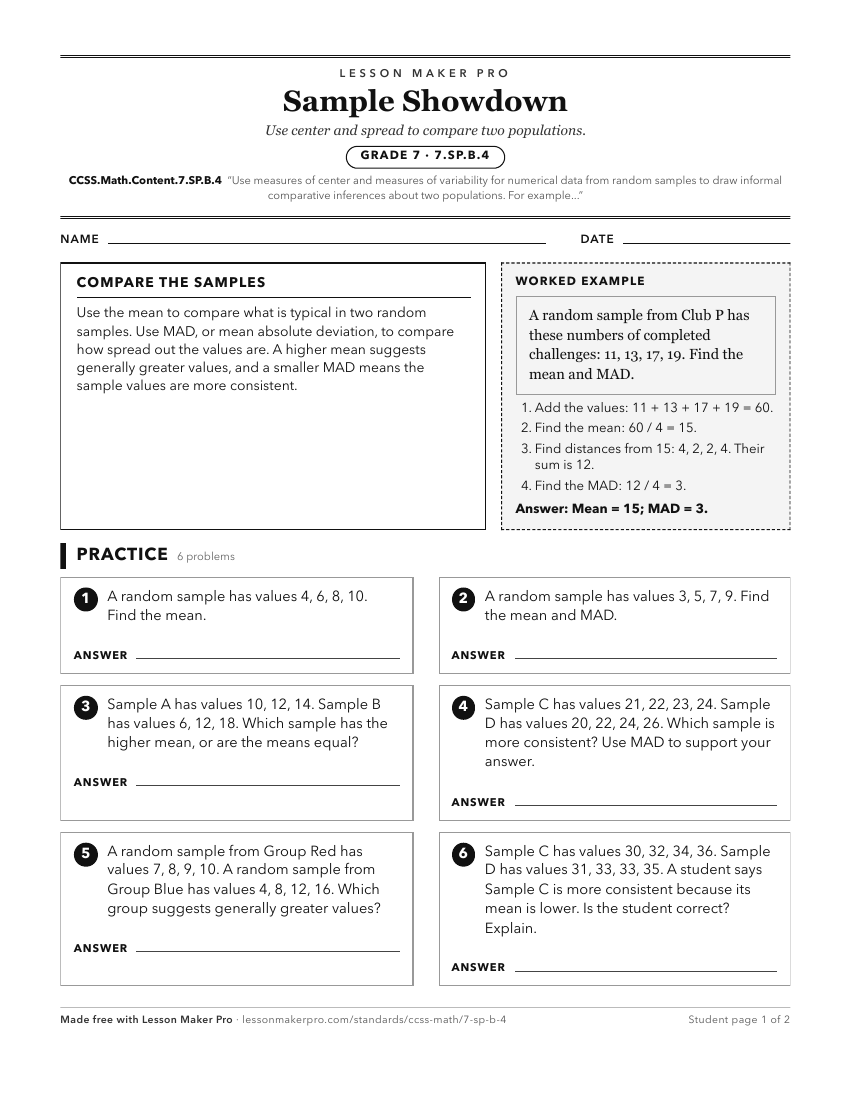
A ready-to-print activity worksheet aligned to CCSS.Math.Content.7.SP.B.4, with an answer key for the teacher on its own page. No account needed.
PDF, US Letter, prints cleanly in black and white.
Download the worksheetLearning progression
Where This Standard Sits
See the whole path on the Statistics & Probability progression map.
Before This Standard
If students are struggling here, check these first.
- CCSS.Math.Content.7.SP.A.1
Understanding representative random samples supports trusting sample centers and variability when making informal comparisons between two populations.
- CCSS.Math.Content.6.SP.B.5c
Comparing two populations requires using mean or median and variability measures already learned to summarize and interpret numerical data.
- CCSS.Math.Content.7.SP.B.3
Comparing centers relative to variability helps students justify informal conclusions about differences between two populations from sample data.
What This Unlocks
Mastery here sets students up for these next.
- CCSS.Math.Content.HSS-ID.A.2
Comparing populations with center and variability prepares students to choose and compare mean, median, IQR, and standard deviation across data sets.
- CCSS.Math.Content.HSS-ID.A.3
Using center and variability to compare groups prepares students to interpret center, spread, shape, and outlier effects in data contexts.
Keep exploring
Related Standards
Turn this exact standard into a lesson
Grade, subject, topic, and the complete standard are prefilled. Create one free, no account needed.
Also for this standard:Make a WorksheetMake a QuizMake a Sub Lesson