CCSS.
The Standard
Use statistics appropriate to the shape of the data distribution to compare center (median, mean) and spread (interquartile range, standard deviation) of two or more different data sets.
Common Core State Standards for Mathematics
Teacher's field guide
What This Standard Means
What Students Need to Do
- Students compare two or more numerical data sets using measures that fit each distribution's shape. They use mean and standard deviation for roughly symmetric data, and median and IQR for skewed data or data with outliers.
What Mastery Looks Like
- Students identify each distribution as roughly symmetric, skewed, or affected by outliers. They select matching measures, calculate them accurately, and explain which group is typical and which is more variable.
Common Misconceptions
- Students may choose the mean for every data set, even when skew or outliers make it misleading. They may confuse variability with center or compare standard deviations when medians and IQRs are more suitable.
How to Assess It
- Give students two dot plots, one symmetric and one skewed. Ask them to choose appropriate measures, calculate them, and write one comparison sentence using center and spread.
Lesson moves
Ways to Teach It
Build two class data sets with sticky note dot plots, then calculate and compare mean, median, IQR, and standard deviation.
Show two salary distributions and ask, "Which measures give the fairest comparison, and what features of the graphs support your choice?"
Play Measure Match by sorting distribution cards into mean and standard deviation or median and IQR, then justify each placement.
Compare commute times for two neighborhoods and write a recommendation based on each distribution's center, spread, skew, and outliers.
Free download
Printable HSS-ID.A.2 Worksheet
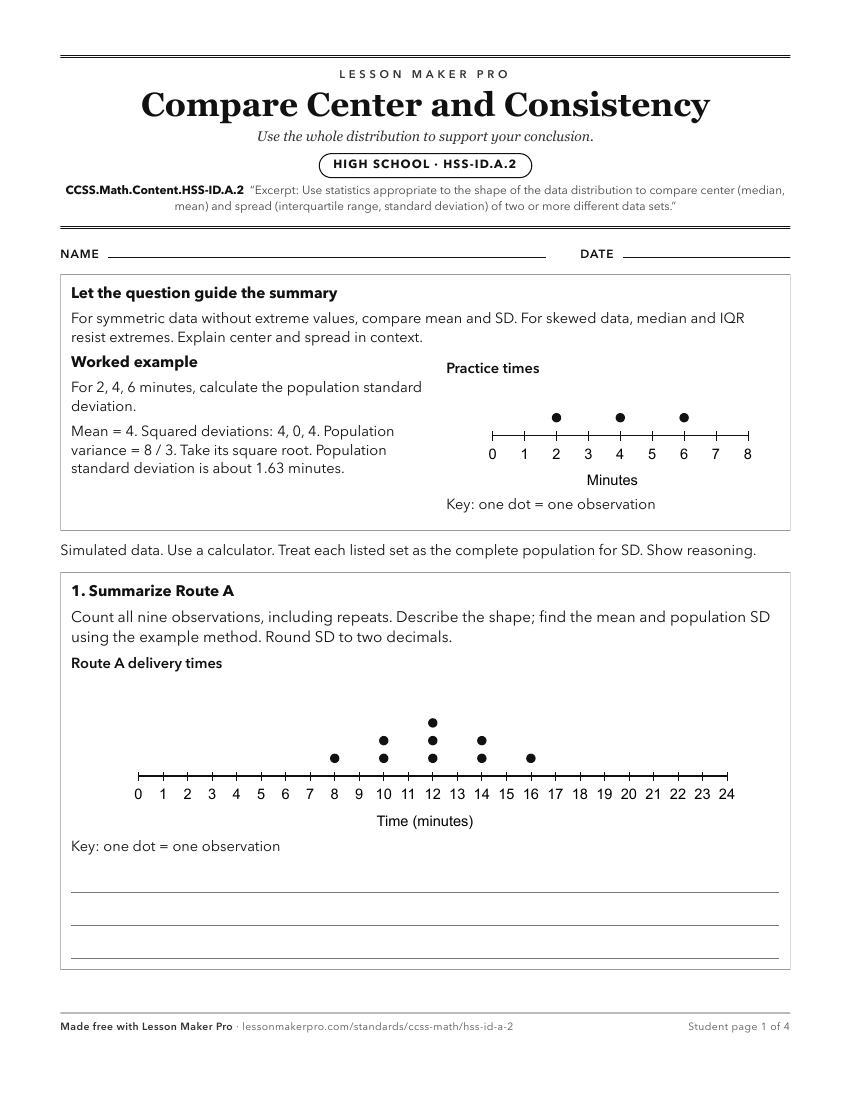
A ready-to-print activity worksheet aligned to CCSS.Math.Content.HSS-ID.A.2, with an answer key for the teacher on its own page. No account needed.
PDF, US Letter, prints cleanly in black and white.
Download the worksheetLearning progression
Where This Standard Sits
Before This Standard
If students are struggling here, check these first.
- CCSS.Math.Content.HSS-ID.A.1
Reading dot plots, histograms, and box plots helps students see distribution shape before choosing center and spread measures to compare data sets.
- CCSS.Math.Content.7.SP.B.4
Comparing populations with center and variability prepares students to choose and compare mean, median, IQR, and standard deviation across data sets.
- CCSS.Math.Content.7.SP.B.3
Comparing centers and variability across distributions directly supports choosing and interpreting mean, median, IQR, and standard deviation in high school.
What This Unlocks
Mastery here sets students up for these next.
- CCSS.Math.Content.HSS-ID.A.3
Choosing and comparing mean, median, IQR, and standard deviation is needed to explain distribution differences and outlier effects in context.
- CCSS.Math.Content.HSS-ID.A.4
Choosing mean and standard deviation by distribution shape supports judging when a normal model is appropriate and interpreting its estimates.
- CCSS.Math.Content.HSS-IC.A.1
Understanding mean, median, and variability helps students see how sample statistics can estimate population parameters.
- CCSS.Math.Content.HSS-MD.A.2
Understanding mean as a distribution’s center supports interpreting expected value as the long-run mean of a probability distribution.
Keep exploring
Related Standards
- CCSS.Math.Content.6.SP.B.5d
Relating the choice of measures of center and variability to the shape of the data distribution and the context in which the data were gathered.
- CCSS.Math.Content.6.SP.B.5c
Giving quantitative measures of center (median and/or mean) and variability (interquartile range and/or mean absolute deviation), as well as describing any over...
- CCSS.Math.Content.6.SP.A.2
Understand that a set of data collected to answer a statistical question has a distribution which can be described by its center, spread, and overall shape.
Turn this exact standard into a lesson
Grade, subject, topic, and the complete standard are prefilled. Create one free, no account needed.
Also for this standard:Make a WorksheetMake a QuizMake a Sub Lesson