CCSS.
The Standard
Relating the choice of measures of center and variability to the shape of the data distribution and the context in which the data were gathered.
Common Core State Standards for Mathematics
Teacher's field guide
What This Standard Means
What Students Need to Do
- Students examine a distribution’s shape, outliers, and context before choosing measures of center and variability. They explain why mean and MAD or median and IQR give a useful summary.
What Mastery Looks Like
- Students identify whether a distribution is roughly symmetric, skewed, or affected by outliers. They choose mean and MAD for balanced data, or median and IQR for skewed data, and explain why.
Common Misconceptions
- Students may always choose the mean because it uses every value. They may miss how an outlier pulls the mean and MAD, or think the largest value must be removed.
How to Assess It
- Exit ticket: Delivery times were 5, 6, 6, 7, 7, 8, 8, and 30 minutes. Choose mean and MAD or median and IQR, then justify your choice.
Lesson moves
Ways to Teach It
Build two dot plots with sticky notes, add one extreme value to one plot, then compare how the mean, median, MAD, and IQR change.
Ask students to write which measures best describe a skewed salary distribution and explain what information the other measures might hide.
Sort dataset cards into mean and MAD or median and IQR piles, then earn a point for each correct spoken justification.
Compare home prices from two neighborhoods and decide which center and variability measures would give a buyer the clearest summary.
Free download
Printable 6.SP.B.5d Worksheet
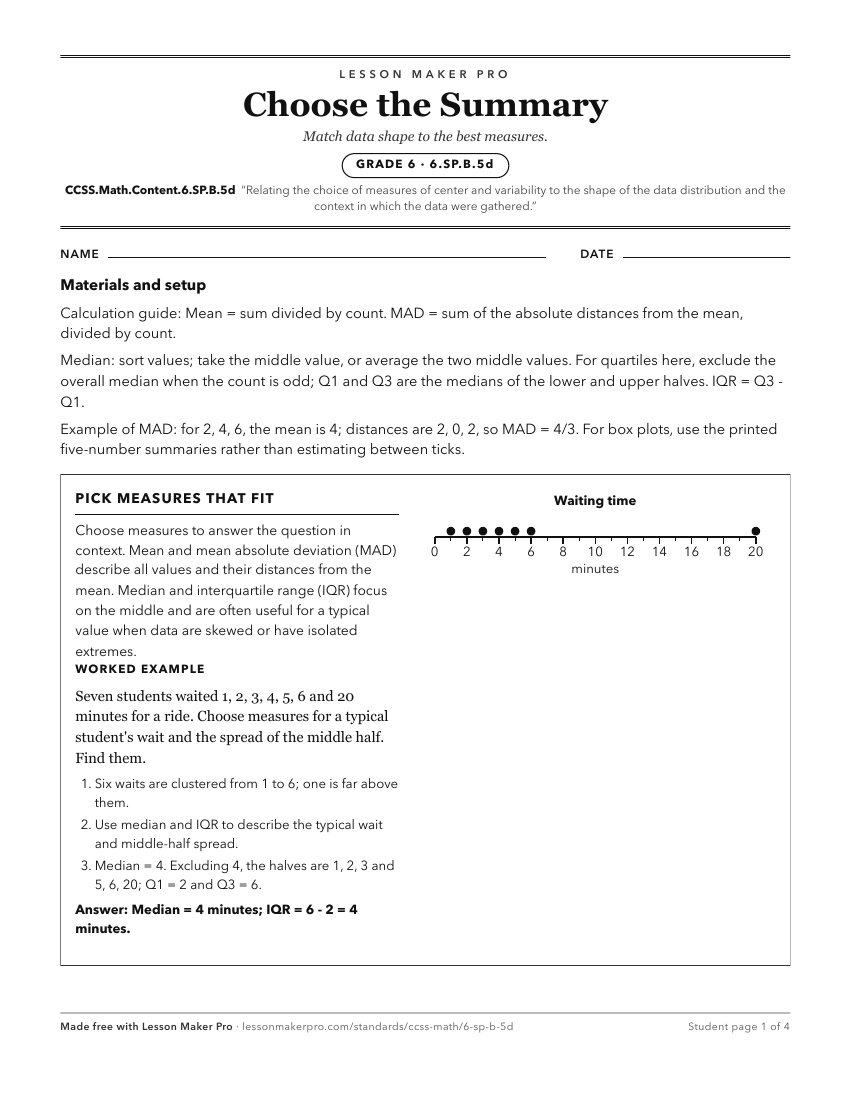
A ready-to-print activity worksheet aligned to CCSS.Math.Content.6.SP.B.5d, with an answer key for the teacher on its own page. No account needed.
PDF, US Letter, prints cleanly in black and white.
Download the worksheetLearning progression
Where This Standard Sits
Before This Standard
If students are struggling here, check these first.
- CCSS.Math.Content.6.SP.A.2
Students must recognize center, spread, and shape before deciding which measures best fit a distribution and its context.
- CCSS.Math.Content.6.SP.A.3
Choosing measures for a distribution requires knowing that center summarizes typical value and variability summarizes spread.
- CCSS.Math.Content.6.SP.B.5c
Students must know and describe center, variability, patterns, and outliers before deciding which measures fit a distribution and context.
Keep exploring
Related Standards
- CCSS.Math.Content.HSS-ID.A.3
Interpret differences in shape, center, and spread in the context of the data sets, accounting for possible effects of extreme data points (outliers).
- CCSS.Math.Content.HSS-ID.A.2
Use statistics appropriate to the shape of the data distribution to compare center (median, mean) and spread (interquartile range, standard deviation) of two or...
Turn this exact standard into a lesson
Grade, subject, topic, and the complete standard are prefilled. Create one free, no account needed.
Also for this standard:Make a WorksheetMake a QuizMake a Sub Lesson