CCSS.
The Standard
Understand that statistics can be used to gain information about a population by examining a sample of the population; generalizations about a population from a sample are valid only if the sample is representative of that population. Understand that random sampling tends to produce representative samples and support valid inferences.
Common Core State Standards for Mathematics · Statistics and Probability
Teacher's field guide
What This Standard Means
What Students Need to Do
- Students identify the larger group being studied and the smaller group surveyed. They judge whether a sampling method avoids predictable bias. They use a fair sample to make a supported estimate about the larger group.
What Mastery Looks Like
- Students can identify the population and sample in a survey. They can explain whether the selection method is likely to produce a fair sample. They can make a reasonable prediction while noting limits caused by bias.
Common Misconceptions
- Students may think any small group fairly represents a larger group. They may also confuse random selection with choosing people quickly, evenly, or conveniently.
How to Assess It
- Exit ticket: A principal surveys the first 30 students entering a basketball game, and 24 support more sports funding. Can the principal conclude that 80% of all students agree? Explain and give a better sampling plan.
Lesson moves
Ways to Teach It
Fill a bag with 100 colored counters, draw 10 without looking, and compare the sample proportions with the bag’s actual proportions.
Discuss: Why might surveying only students in the library give a poor estimate of how all students spend lunch?
Play Sample Sort with method cards, sorting each as random or biased and revising biased methods.
Use randomly selected student ID numbers to survey a school preference, then use the results to predict the whole school’s response.
Free download
Printable 7.SP.A.1 Worksheet
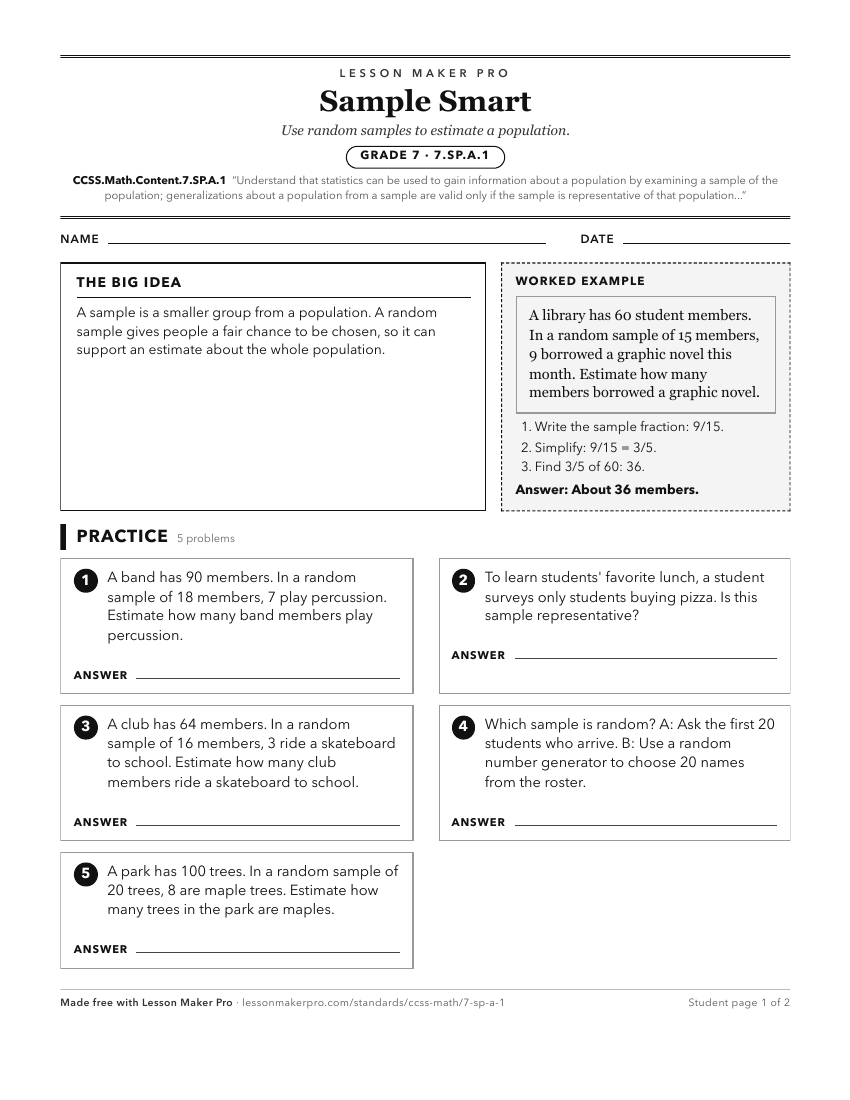
A ready-to-print activity worksheet aligned to CCSS.Math.Content.7.SP.A.1, with an answer key for the teacher on its own page. No account needed.
PDF, US Letter, prints cleanly in black and white.
Download the worksheetLearning progression
Where This Standard Sits
See the whole path on the Statistics & Probability progression map.
Before This Standard
If students are struggling here, check these first.
- CCSS.Math.Content.6.SP.A.1
Recognizing variability in statistical questions supports understanding why samples vary and why representativeness matters for population inferences.
- CCSS.Math.Content.6.SP.A.2
Describing a data distribution by center, spread, and shape helps students see whether a sample can represent a population.
- CCSS.Math.Content.6.SP.B.5
Summarizing data in context supports seeing sample results as evidence about a larger population and judging whether inferences make sense.
What This Unlocks
Mastery here sets students up for these next.
- CCSS.Math.Content.7.SP.B.4
Understanding representative random samples supports trusting sample centers and variability when making informal comparisons between two populations.
- CCSS.Math.Content.HSS-IC.A.1
Students need the population, sample, random sampling, and valid inference ideas before reasoning about estimating population parameters.
- CCSS.Math.Content.7.SP.A.2
Students must understand representative random samples before using sample data and sampling variation to make valid population inferences.
- CCSS.Math.Content.HSS-IC.B.3
Understanding representative random samples supports explaining random selection in surveys and contrasting it with random assignment in experiments.
- CCSS.Math.Content.HSS-IC.B.4
Estimating population values and margins of error requires understanding random samples as representative evidence for valid population inferences.
Keep exploring
Related Standards
Turn this exact standard into a lesson
Grade, subject, topic, and the complete standard are prefilled. Create one free, no account needed.
Also for this standard:Make a WorksheetMake a QuizMake a Sub Lesson