CCSS.
Standard Cluster
Make inferences and justify conclusions from sample surveys, experiments, and observational studies
Common Core State Standards for Mathematics · High School — Statistics and Probability
Cluster contents
Standards in This Cluster
CCSS.Math.Content.HSS-IC.B is a cluster heading. These are the individual standards under it.
- CCSS.Math.Content.HSS-IC.B.3
Recognize the purposes of and differences among sample surveys, experiments, and observational studies; explain how randomization relates to each.
- CCSS.Math.Content.HSS-IC.B.4
Use data from a sample survey to estimate a population mean or proportion; develop a margin of error through the use of simulation models for random sampling.
- CCSS.Math.Content.HSS-IC.B.5
Use data from a randomized experiment to compare two treatments; use simulations to decide if differences between parameters are significant.
- CCSS.Math.Content.HSS-IC.B.6
Evaluate reports based on data.
Teacher's field guide
What This Cluster Means
What Students Need to Do
- Students draw reasonable conclusions from surveys, experiments, and observational data. They explain how sampling and study design affect generalization, bias, and cause-and-effect claims.
What Mastery Looks Like
- Students identify the population, sample, variables, and study type. They use the data to support a conclusion, state its limits, and distinguish association from causation.
Common Misconceptions
- Students often confuse random sampling with random assignment. They may assume a large sample removes bias, or claim that an observed association proves causation.
How to Assess It
- Give this prompt: “A school randomly selects 80 students and compares sleep hours with grades. What conclusions are justified, and can causation be claimed?”
Lesson moves
Ways to Teach It
Draw repeated samples of colored beads from a bag, record proportions, and compare how sample results vary around the full bag proportion.
Write a response to: “When can results describe a population, and when can they support a cause-and-effect claim?”
Sort study cards into sample survey, experiment, or observational study, then match each card with a justified conclusion.
Analyze a news poll by checking its sample, wording, margin of error, population, and whether the headline matches the evidence.
Free download
Printable HSS-IC.B Worksheet
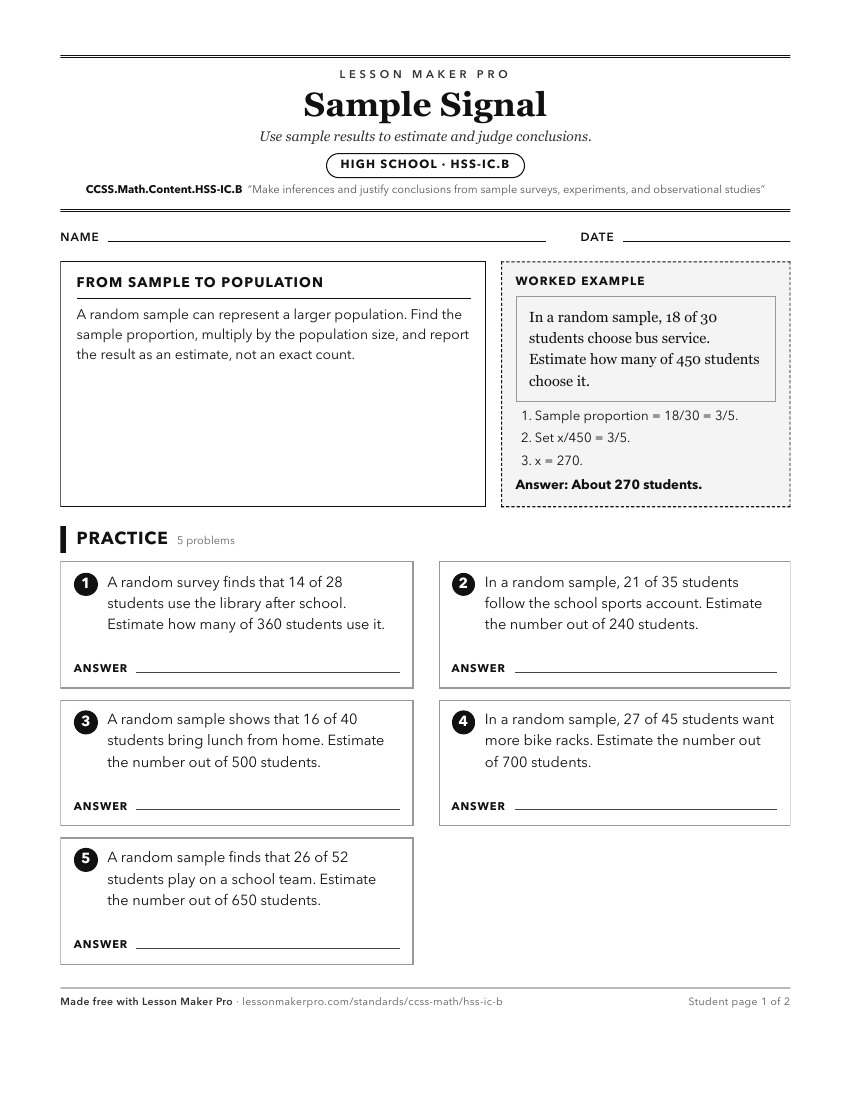
A ready-to-print activity worksheet aligned to CCSS.Math.Content.HSS-IC.B, with an answer key for the teacher on its own page. No account needed.
PDF, US Letter, prints cleanly in black and white.
Download the worksheetKeep exploring
Related Standards
- CCSS.Math.Content.7.SP.A
Use random sampling to draw inferences about a population.
- CCSS.Math.Content.7.SP.A.2
Use data from a random sample to draw inferences about a population with an unknown characteristic of interest. Generate multiple samples (or simulated samples)...
- CCSS.Math.Content.7.SP.A.1
Understand that statistics can be used to gain information about a population by examining a sample of the population; generalizations about a population from a...
Turn this cluster into a lesson
Grade, subject, topic, and the complete cluster are prefilled. Create one free, no account needed.
Also for this cluster:Make a WorksheetMake a QuizMake a Sub Lesson