CCSS.
The Standard
Use data from a random sample to draw inferences about a population with an unknown characteristic of interest. Generate multiple samples (or simulated samples) of the same size to gauge the variation in estimates or predictions.
Common Core State Standards for Mathematics · Statistics and Probability
Teacher's field guide
What This Standard Means
What Students Need to Do
- Students use a random sample to estimate an unknown population mean, proportion, or outcome. They compare several equal-sized samples to see how much estimates vary.
What Mastery Looks Like
- Students calculate an estimate from each random sample and compare the results. They use the range or clustering of estimates to describe a reasonable prediction and possible error.
Common Misconceptions
- Students may treat friends or volunteers as a random sample. They may assume one sample gives the exact population value or expect repeated samples to match.
How to Assess It
- Exit ticket: Five random samples predict 45%, 48%, 50%, 52%, and 55% support. Estimate overall support and explain how far off it might be.
Lesson moves
Ways to Teach It
Place colored counters in a hidden bag, have students draw repeated samples of 20, and compare their estimated color proportions.
Ask students to explain why five random samples from the same population can produce different estimates.
Teams use a random-number generator to select repeated samples from a class data table and score points for estimates near the population value.
Use a student roster and random numbers to survey lunch preferences, then compare sample predictions with a full-class count.
Free download
Printable 7.SP.A.2 Worksheet
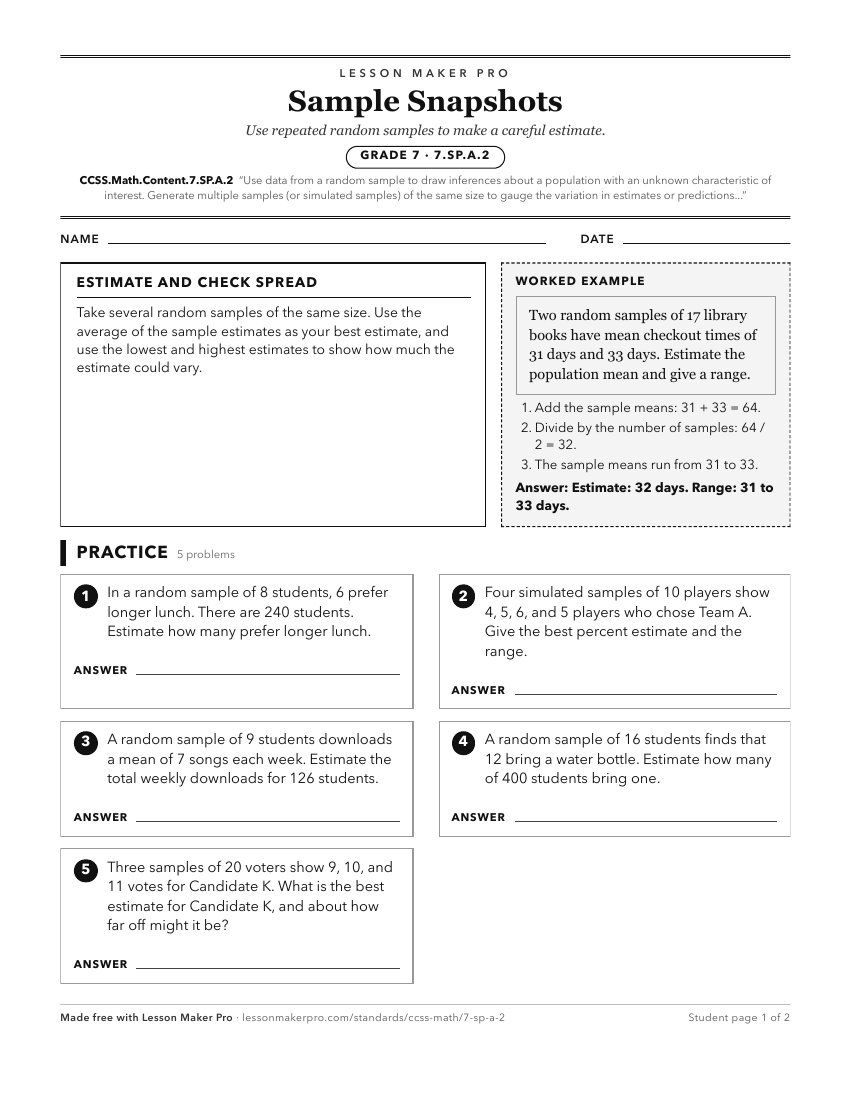
A ready-to-print activity worksheet aligned to CCSS.Math.Content.7.SP.A.2, with an answer key for the teacher on its own page. No account needed.
PDF, US Letter, prints cleanly in black and white.
Download the worksheetLearning progression
Where This Standard Sits
See the whole path on the Statistics & Probability progression map.
Before This Standard
If students are struggling here, check these first.
- CCSS.Math.Content.7.SP.A.1
Students must understand representative random samples before using sample data and sampling variation to make valid population inferences.
- CCSS.Math.Content.6.SP.A.2
Describing distributions by center, spread, and shape supports comparing random samples and judging how sample estimates vary.
- CCSS.Math.Content.6.SP.A.1
Anticipating variability in data supports understanding why random samples can differ and why estimates need comparison across samples.
What This Unlocks
Mastery here sets students up for these next.
- CCSS.Math.Content.HSS-IC.A.1
Using random samples to infer population traits and see sample variation prepares students for formal inference about population parameters.
- CCSS.Math.Content.HSS-IC.B.4
Students extend random-sample inference and sampling variability into estimating means or proportions with simulation-based margins of error.
Keep exploring
Related Standards
Turn this exact standard into a lesson
Grade, subject, topic, and the complete standard are prefilled. Create one free, no account needed.
Also for this standard:Make a WorksheetMake a QuizMake a Sub Lesson