CCSS.
The Standard
Informally assess the degree of visual overlap of two numerical data distributions with similar variabilities, measuring the difference between the centers by expressing it as a multiple of a measure of variability.
Common Core State Standards for Mathematics · Statistics and Probability
Teacher's field guide
What This Standard Means
What Students Need to Do
- Students compare two numerical distributions shown on the same scale. They judge how much the plots overlap and check that the spreads are similar. They express the difference between the means as a number of mean absolute deviations.
What Mastery Looks Like
- A student identifies each mean and MAD, then describes the visible overlap accurately. The student divides the difference between means by either MAD when the MADs are close and makes a cautious comparison.
Common Misconceptions
- Students may compare only the means and assume every value in the higher group is larger. They may divide by the mean instead of the MAD, or count spaces on plots with different scales. Some treat any overlap as proof that the groups are the same.
How to Assess It
- Exit ticket: Plot A = 10, 12, 14, 14, 16, 18 and B = 16, 18, 20, 20, 22, 24. Describe the overlap, find both MADs, and state the mean difference in MAD units.
Lesson moves
Ways to Teach It
Have pairs make stacked-cube dot plots for two six-value data sets, then place string at each mean and one MAD from it.
Ask, "If two groups overlap, can one still tend to have larger values?" Students cite plot evidence in a three-sentence response.
Run a card sort matching paired dot plots with claims such as "about two MADs apart" and "large visual overlap."
Compare 14 daily high temperatures from two cities, plot both sets, and report the mean difference in MAD units.
Free download
Printable 7.SP.B.3 Worksheet
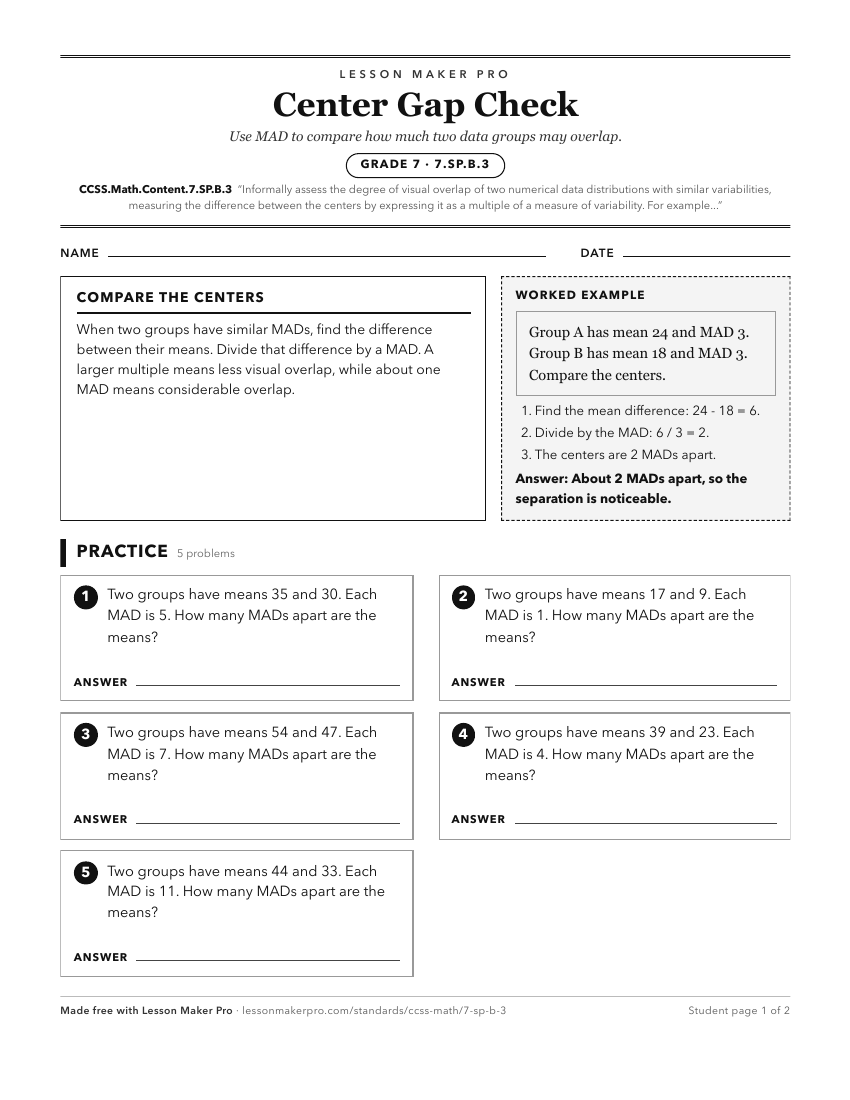
A ready-to-print activity worksheet aligned to CCSS.Math.Content.7.SP.B.3, with an answer key for the teacher on its own page. No account needed.
PDF, US Letter, prints cleanly in black and white.
Download the worksheetLearning progression
Where This Standard Sits
See the whole path on the Statistics & Probability progression map.
Before This Standard
If students are struggling here, check these first.
- CCSS.Math.Content.6.SP.B.4
Reading dot plots, histograms, and box plots supports comparing two distributions’ overlap, centers, and spread visually.
- CCSS.Math.Content.6.SP.B.5c
Comparing two distributions by center difference relative to variability requires knowing how center and variability summarize a distribution.
- CCSS.Math.Content.6.SP.A.2
Comparing two distributions by overlap and center difference requires understanding each distribution’s center, spread, and shape.
What This Unlocks
Mastery here sets students up for these next.
- CCSS.Math.Content.7.SP.B.4
Comparing centers relative to variability helps students justify informal conclusions about differences between two populations from sample data.
- CCSS.Math.Content.HSS-ID.A.2
Comparing centers and variability across distributions directly supports choosing and interpreting mean, median, IQR, and standard deviation in high school.
Keep exploring
Related Standards
Turn this exact standard into a lesson
Grade, subject, topic, and the complete standard are prefilled. Create one free, no account needed.
Also for this standard:Make a WorksheetMake a QuizMake a Sub Lesson