CCSS.
The Standard
Represent data with plots on the real number line (dot plots, histograms, and box plots).
Common Core State Standards for Mathematics
Teacher's field guide
What This Standard Means
What Students Need to Do
- Students turn a list of numerical values into dot plots, histograms, and box plots. They choose and label a useful scale, group values correctly, and show frequencies or summary points accurately.
What Mastery Looks Like
- Students create accurate dot plots, histograms, and box plots from the same numerical data set. They label scales, count every observation, use consistent histogram intervals, and place the five-number summary correctly.
Common Misconceptions
- Students may place one dot per value instead of one dot per observation, so repeated values are not stacked. They may use unequal histogram intervals, count boundary values twice, or confuse box edges with the minimum and maximum.
How to Assess It
- Give students the data 2, 3, 3, 4, 6, 7, 7, 7, 8, 10. Ask them to make a dot plot, a box plot, and a histogram using intervals 0–2, 3–5, 6–8, and 9–11.
Lesson moves
Ways to Teach It
Tape a number line on the floor, give each student a data card, and have them stack behind classmates with matching values.
Show three displays of one data set and ask students to write which features each display makes easiest to see.
Run an error hunt using flawed plots with missing labels, uneven intervals, misplaced quartiles, or incorrect frequencies.
Collect class commute times, then have pairs make a histogram and explain what the display shows about typical travel time.
Free download
Printable HSS-ID.A.1 Worksheet
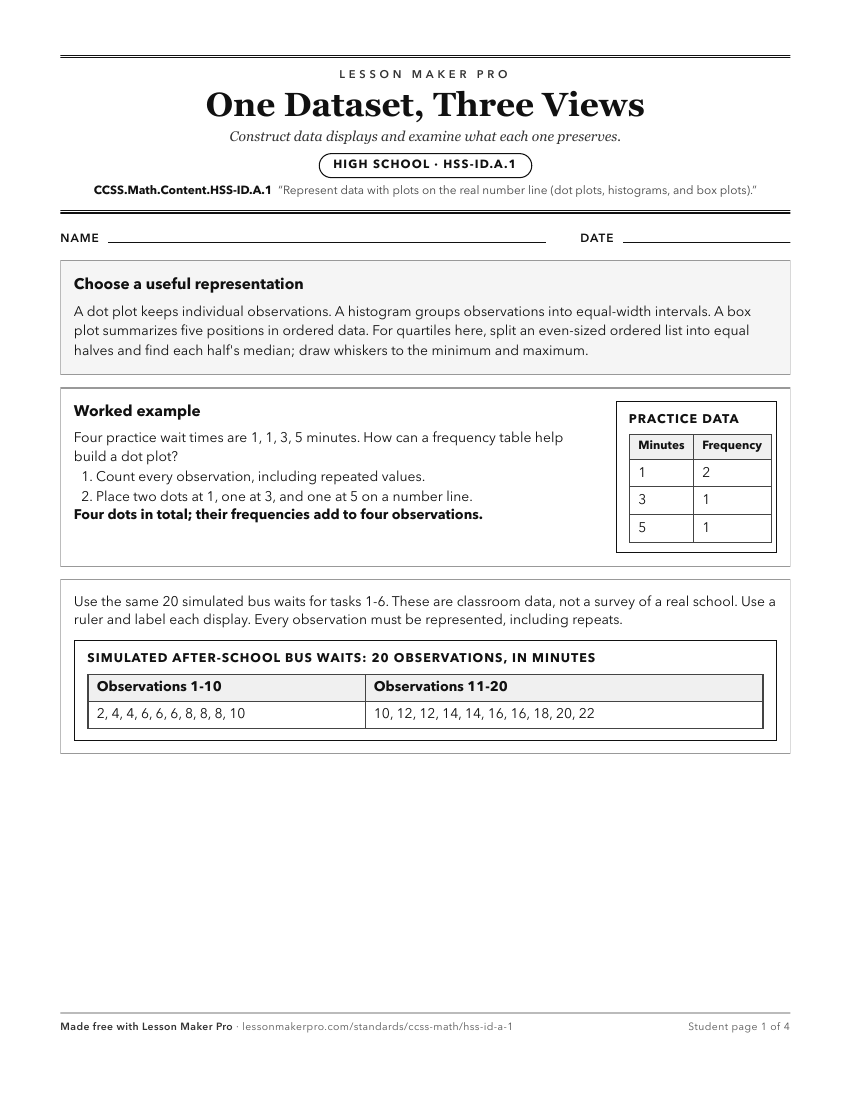
A ready-to-print activity worksheet aligned to CCSS.Math.Content.HSS-ID.A.1, with an answer key for the teacher on its own page. No account needed.
PDF, US Letter, prints cleanly in black and white.
Download the worksheetLearning progression
Where This Standard Sits
What This Unlocks
Mastery here sets students up for these next.
- CCSS.Math.Content.HSS-ID.A.2
Reading dot plots, histograms, and box plots helps students see distribution shape before choosing center and spread measures to compare data sets.
- CCSS.Math.Content.HSS-ID.A.3
Making dot plots, histograms, and box plots supports comparing shape, center, spread, and spotting outliers in context.
- CCSS.Math.Content.HSS-MD.A.1
Dot plots, histograms, and box plots carry over when graphing probability distributions for values of a random variable.
Keep exploring
Related Standards
- CCSS.Math.Content.HSS-ID.B.6
Represent data on two quantitative variables on a scatter plot, and describe how the variables are related.
- CCSS.Math.Content.6.SP.B.4
Display numerical data in plots on a number line, including dot plots, histograms, and box plots.
- CCSS.Math.Content.5.MD.B.2
Make a line plot to display a data set of measurements in fractions of a unit (1/2, 1/4, 1/8). Use operations on fractions for this grade to solve problems invo...
- CCSS.Math.Content.4.MD.B.4
Make a line plot to display a data set of measurements in fractions of a unit (1/2, 1/4, 1/8). Solve problems involving addition and subtraction of fractions by...
Turn this exact standard into a lesson
Grade, subject, topic, and the complete standard are prefilled. Create one free, no account needed.
Also for this standard:Make a WorksheetMake a QuizMake a Sub Lesson