CCSS.
The Standard
(+) Define a random variable for a quantity of interest by assigning a numerical value to each event in a sample space; graph the corresponding probability distribution using the same graphical displays as for data distributions.
Common Core State Standards for Mathematics
Teacher's field guide
What This Standard Means
What Students Need to Do
- Students choose a numerical variable that captures a quantity from a chance situation. They connect every possible outcome to a value, combine probabilities for repeated values, and graph value against probability.
What Mastery Looks Like
- Given a sample space, students can define a numerical variable and make a complete probability table and graph. Their probabilities are correct, total 1, and appear on the correct graph axes.
Common Misconceptions
- Students may list outcomes such as HH and HT as variable values instead of mapping them to numbers. They may forget to add probabilities when several outcomes produce the same value. They may graph trial counts instead of probabilities, or create probabilities that do not total 1.
How to Assess It
- Give this exit ticket: A game pays $0 for no heads, $2 for one head, and $5 for two heads after two fair coin flips. Make a probability table and graph.
Lesson moves
Ways to Teach It
Use two dice and a 36-cell outcome grid to group sums, calculate each probability, and graph the distribution.
Ask, “For two coin flips, how do number of heads and winnings describe the same outcomes differently?”
Draw cards labeled red, blue, and gold with assigned points, then race to complete the correct probability table and graph.
Model an insurance payout from listed claim outcomes, then graph payout amounts against their probabilities and explain the most likely cost.
Free download
Printable HSS-MD.A.1 Worksheet
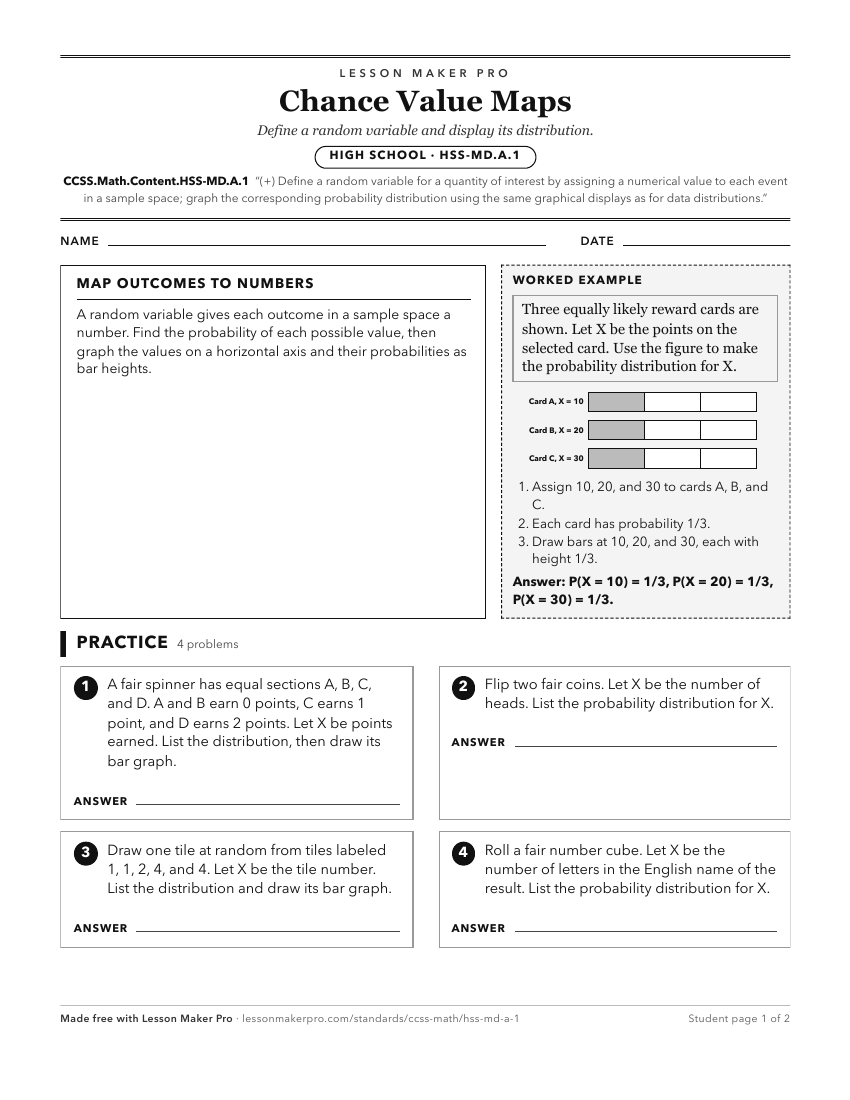
A ready-to-print activity worksheet aligned to CCSS.Math.Content.HSS-MD.A.1, with an answer key for the teacher on its own page. No account needed.
PDF, US Letter, prints cleanly in black and white.
Download the worksheetLearning progression
Where This Standard Sits
Before This Standard
If students are struggling here, check these first.
- CCSS.Math.Content.HSS-CP.A.1
Random variables require identifying outcomes and events in a sample space before assigning numbers and graphing their probabilities.
- CCSS.Math.Content.7.SP.C.7
Random variables and their distributions require assigning probabilities to sample-space events, which 7.SP.C.7 develops through probability models.
- CCSS.Math.Content.HSS-ID.A.1
Dot plots, histograms, and box plots carry over when graphing probability distributions for values of a random variable.
What This Unlocks
Mastery here sets students up for these next.
- CCSS.Math.Content.HSS-MD.A.2
Expected value uses the random variable’s numerical outcomes and probabilities, then interprets that distribution’s mean.
- CCSS.Math.Content.HSS-MD.A.3
Finding expected value requires assigning numerical outcomes and organizing their probabilities as a distribution first.
- CCSS.Math.Content.HSS-MD.A.4
Students must define the random variable and organize its probability distribution before using empirical probabilities to compute expected value.
- CCSS.Math.Content.HSS-MD.B.5
Expected value requires treating payoffs as a random variable with probabilities attached to each possible value.
Keep exploring
Related Standards
Turn this exact standard into a lesson
Grade, subject, topic, and the complete standard are prefilled. Create one free, no account needed.
Also for this standard:Make a WorksheetMake a QuizMake a Sub Lesson