CCSS.
Standard Cluster
Summarize, represent, and interpret data on two categorical and quantitative variables
Common Core State Standards for Mathematics · High School — Statistics and Probability
Cluster contents
Standards in This Cluster
CCSS.Math.Content.HSS-ID.B is a cluster heading. These are the individual standards under it.
- CCSS.Math.Content.HSS-ID.B.5
Summarize categorical data for two categories in two-way frequency tables. Interpret relative frequencies in the context of the data (including joint, marginal,...
- CCSS.Math.Content.HSS-ID.B.6
Represent data on two quantitative variables on a scatter plot, and describe how the variables are related.
- CCSS.Math.Content.HSS-ID.B.6a
Fit a function to the data; use functions fitted to data to solve problems in the context of the data.
- CCSS.Math.Content.HSS-ID.B.6b
Informally assess the fit of a function by plotting and analyzing residuals.
- CCSS.Math.Content.HSS-ID.B.6c
Fit a linear function for a scatter plot that suggests a linear association.
Teacher's field guide
What This Cluster Means
What Students Need to Do
- Students organize paired category data in two-way tables and paired numerical data in scatterplots. They compare conditional percentages and describe patterns, including direction, shape, strength, and outliers. They use fitted models for estimates and explain why association does not prove causation.
What Mastery Looks Like
- Students choose a useful display, calculate relative frequencies correctly, and describe direction, form, strength, and outliers. They fit a reasonable model, interpret its values in context, and make predictions within the data range. They clearly separate association from causation.
Common Misconceptions
- Students confuse joint percentages with conditional percentages or use the wrong group as the denominator. They may treat correlation as proof of causation, force a linear model onto a curved pattern, or ignore influential outliers. They may also predict far beyond the observed data range.
How to Assess It
- Exit ticket: Give students one two-way table and one scatterplot. Ask them to calculate a conditional percentage, describe the scatterplot, make one reasonable prediction, and state whether causation is supported.
Lesson moves
Ways to Teach It
Measure hand span and height, plot the paired measurements on a class grid, then describe the pattern and identify possible outliers.
Show a graph of ice cream sales and drownings, then ask students to explain why temperature, not causation, may connect them.
Run a card sort matching datasets with two-way tables, scatterplots, association descriptions, and suitable linear or nonlinear models.
Analyze a school survey on transportation and tardiness, compare conditional percentages, and write a cautious conclusion for the principal.
Free download
Printable HSS-ID.B Worksheet
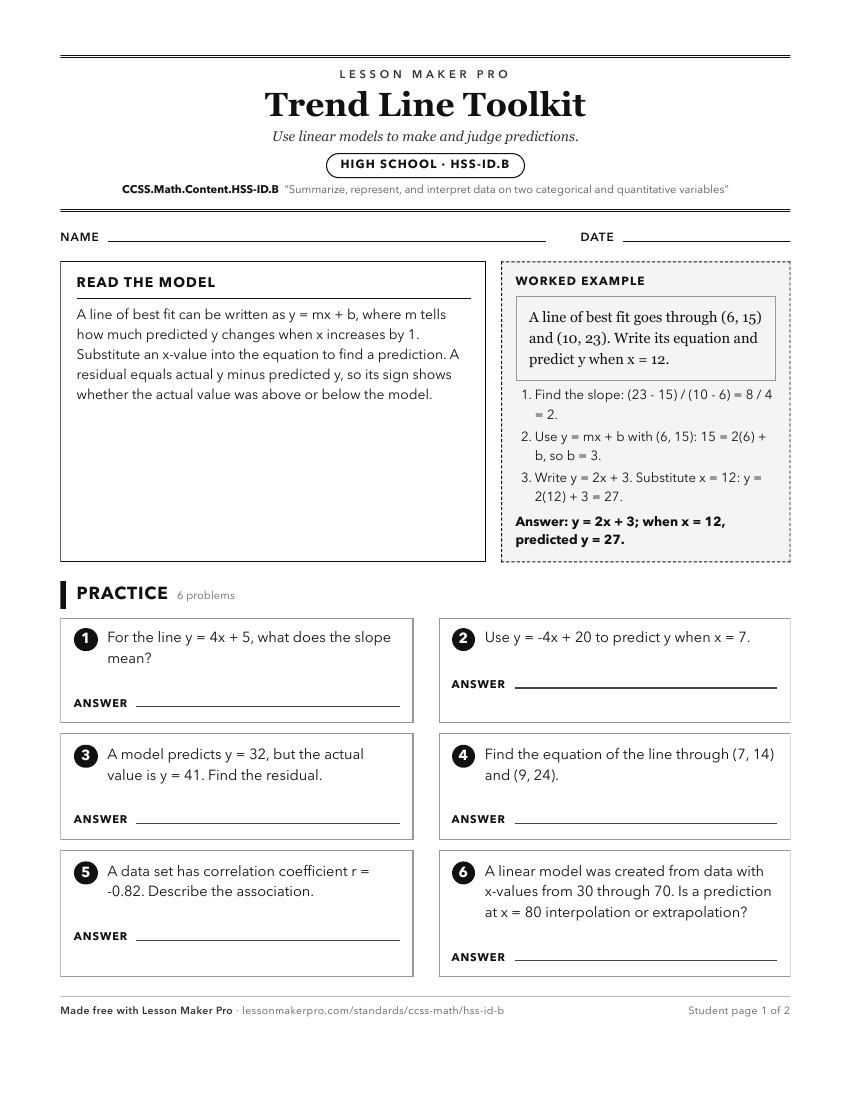
A ready-to-print activity worksheet aligned to CCSS.Math.Content.HSS-ID.B, with an answer key for the teacher on its own page. No account needed.
PDF, US Letter, prints cleanly in black and white.
Download the worksheetKeep exploring
Related Standards
Turn this cluster into a lesson
Grade, subject, topic, and the complete cluster are prefilled. Create one free, no account needed.
Also for this cluster:Make a WorksheetMake a QuizMake a Sub Lesson