CCSS.
Standard Cluster
Summarize, represent, and interpret data on a single count or measurement variable
Common Core State Standards for Mathematics · High School — Statistics and Probability
Cluster contents
Standards in This Cluster
CCSS.Math.Content.HSS-ID.A is a cluster heading. These are the individual standards under it.
- CCSS.Math.Content.HSS-ID.A.1
Represent data with plots on the real number line (dot plots, histograms, and box plots).
- CCSS.Math.Content.HSS-ID.A.2
Use statistics appropriate to the shape of the data distribution to compare center (median, mean) and spread (interquartile range, standard deviation) of two or...
- CCSS.Math.Content.HSS-ID.A.3
Interpret differences in shape, center, and spread in the context of the data sets, accounting for possible effects of extreme data points (outliers).
- CCSS.Math.Content.HSS-ID.A.4
Use the mean and standard deviation of a data set to fit it to a normal distribution and to estimate population percentages. Recognize that there are data sets ...
Teacher's field guide
What This Cluster Means
What Students Need to Do
- Students create and read dot plots, histograms, and box plots for numerical data. They describe shape, center, spread, and outliers. They also decide whether a normal model fits and use it to estimate percentages.
What Mastery Looks Like
- Given a data set, students can choose a useful display and calculate appropriate measures of center and spread. They can describe shape, identify unusual values, and explain each result using the data's context and units.
Common Misconceptions
- Students often treat the mean and median as interchangeable. They may ignore skew, confuse range with interquartile range, or assume every data set follows a normal curve.
How to Assess It
- Give students the data 2, 3, 3, 4, 4, 5, 5, 6, 18. Ask them to draw a box plot, find the median and interquartile range, and describe the outlier.
Lesson moves
Ways to Teach It
Have students measure class reaction times, build a sticky-note dot plot, then calculate the median and interquartile range.
Show two histograms with equal means but different spreads, then ask students to write which group is more consistent and why.
Run a card sort matching data sets, graphs, summary statistics, and written descriptions of shape, center, spread, and outliers.
Use one month of local temperatures to make a histogram and estimate the percentage of days within one standard deviation of the mean.
Free download
Printable HSS-ID.A Worksheet
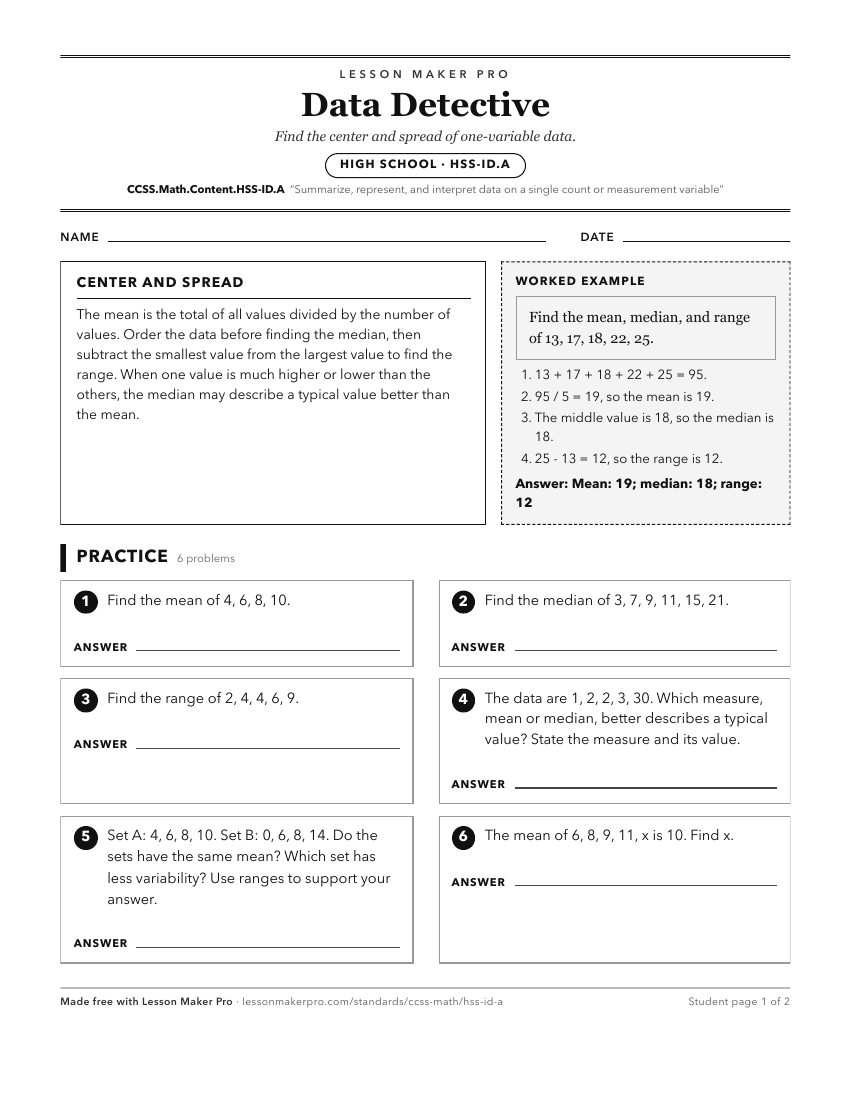
A ready-to-print activity worksheet aligned to CCSS.Math.Content.HSS-ID.A, with an answer key for the teacher on its own page. No account needed.
PDF, US Letter, prints cleanly in black and white.
Download the worksheetKeep exploring
Related Standards
- CCSS.Math.Content.1.MD.C.4
Organize, represent, and interpret data with up to three categories; ask and answer questions about the total number of data points, how many in each category, ...
- CCSS.Math.Content.6.SP.B.5
Summarize numerical data sets in relation to their context, such as by:
- CCSS.Math.Content.6.SP.B
Summarize and describe distributions.
- CCSS.Math.Content.HSS-ID.B
Summarize, represent, and interpret data on two categorical and quantitative variables
Turn this cluster into a lesson
Grade, subject, topic, and the complete cluster are prefilled. Create one free, no account needed.
Also for this cluster:Make a WorksheetMake a QuizMake a Sub Lesson