CCSS.
The Standard
Use the mean and standard deviation of a data set to fit it to a normal distribution and to estimate population percentages. Recognize that there are data sets for which such a procedure is not appropriate. Use calculators, spreadsheets, and tables to estimate areas under the normal curve.
Common Core State Standards for Mathematics
Teacher's field guide
What This Standard Means
What Students Need to Do
- Students decide whether a distribution is roughly bell-shaped and can be modeled with a normal curve. They use its mean and standard deviation to estimate percentages above, below, or between given values.
What Mastery Looks Like
- Students can use a histogram to decide whether a normal model is reasonable. They can convert data values to z-scores and use a calculator, spreadsheet, or table to find percentages within specified intervals.
Common Misconceptions
- Students may assume every data set is normally distributed, even when a histogram is skewed or has strong outliers. They may confuse standard deviation with range or treat curve height as the percentage of data.
How to Assess It
- Exit ticket: A bell-shaped test-score distribution has mean 70 and standard deviation 8. Estimate the percent scoring from 62 to 78, then give one reason the normal model fits.
Lesson moves
Ways to Teach It
Measure classmates' hand spans, build a dot plot, calculate the mean and standard deviation, then judge whether a normal model fits.
Show a symmetric histogram and a right-skewed salary histogram; ask students to defend which one can be modeled normally and why.
Run a card sort matching shaded normal curves, data intervals, z-score intervals, and calculator-generated percentages.
Use bottle-fill measurements to estimate the percentage outside the factory's acceptable range and discuss what that percentage means for production.
Free download
Printable HSS-ID.A.4 Worksheet
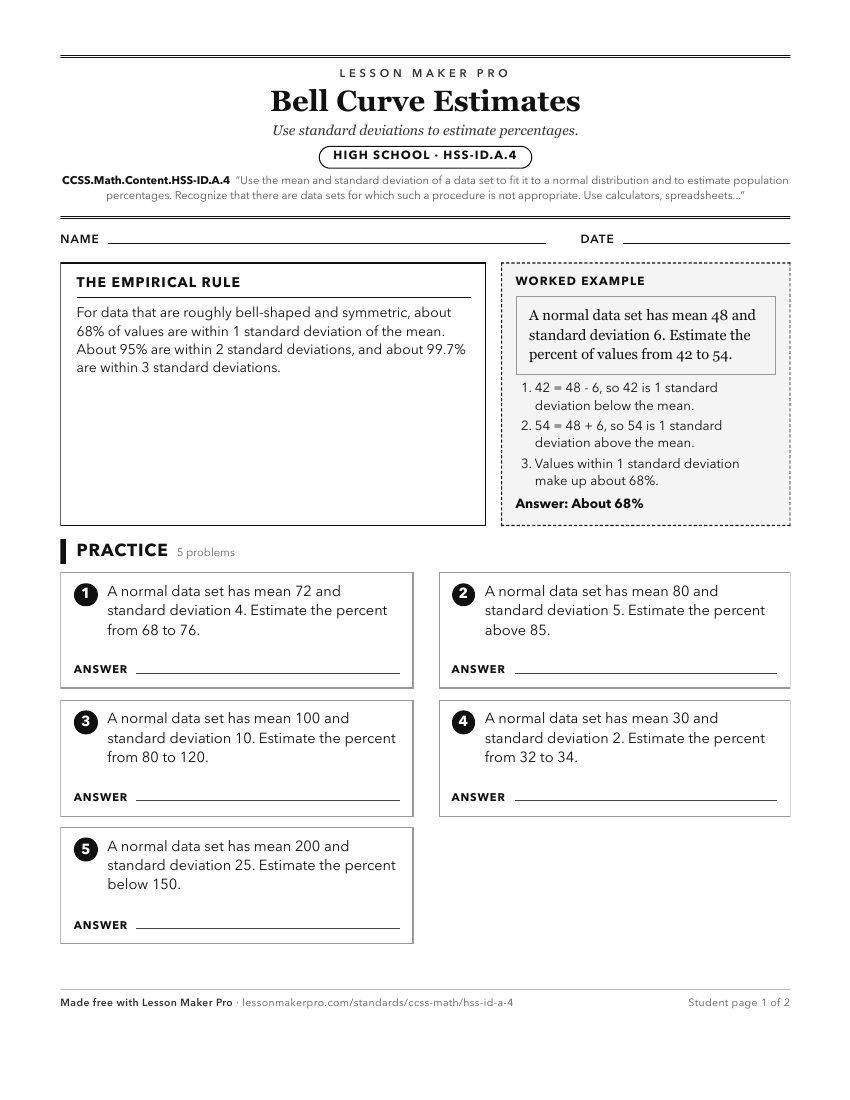
A ready-to-print activity worksheet aligned to CCSS.Math.Content.HSS-ID.A.4, with an answer key for the teacher on its own page. No account needed.
PDF, US Letter, prints cleanly in black and white.
Download the worksheetLearning progression
Where This Standard Sits
Before This Standard
If students are struggling here, check these first.
- CCSS.Math.Content.HSS-ID.A.3
Interpreting shape, center, spread, and outliers helps students judge when mean and standard deviation fit a normal model.
- CCSS.Math.Content.HSS-ID.A.2
Choosing mean and standard deviation by distribution shape supports judging when a normal model is appropriate and interpreting its estimates.
- CCSS.Math.Content.7.RP.A.3
Percent and proportional reasoning support interpreting normal-curve areas as estimated population percentages, though the main new work is statistical modeling.
Keep exploring
Related Standards
- CCSS.Math.Content.HSS-IC.B.4
Use data from a sample survey to estimate a population mean or proportion; develop a margin of error through the use of simulation models for random sampling.
- CCSS.Math.Content.6.SP.B.5c
Giving quantitative measures of center (median and/or mean) and variability (interquartile range and/or mean absolute deviation), as well as describing any over...
- CCSS.Math.Content.6.SP.A.2
Understand that a set of data collected to answer a statistical question has a distribution which can be described by its center, spread, and overall shape.
Turn this exact standard into a lesson
Grade, subject, topic, and the complete standard are prefilled. Create one free, no account needed.
Also for this standard:Make a WorksheetMake a QuizMake a Sub Lesson