CCSS.
Standard Cluster
Summarize and describe distributions.
Common Core State Standards for Mathematics
Cluster contents
Standards in This Cluster
CCSS.Math.Content.6.SP.B is a cluster heading. These are the individual standards under it.
- CCSS.Math.Content.6.SP.B.4
Display numerical data in plots on a number line, including dot plots, histograms, and box plots.
- CCSS.Math.Content.6.SP.B.5
Summarize numerical data sets in relation to their context, such as by:
- CCSS.Math.Content.6.SP.B.5a
Reporting the number of observations.
- CCSS.Math.Content.6.SP.B.5b
Describing the nature of the attribute under investigation, including how it was measured and its units of measurement.
- CCSS.Math.Content.6.SP.B.5c
Giving quantitative measures of center (median and/or mean) and variability (interquartile range and/or mean absolute deviation), as well as describing any over...
- CCSS.Math.Content.6.SP.B.5d
Relating the choice of measures of center and variability to the shape of the data distribution and the context in which the data were gathered.
Teacher's field guide
What This Cluster Means
What Students Need to Do
- Students organize numerical data in dot plots, histograms, and box plots. They describe shape, center, spread, clusters, gaps, and unusual values. They interpret mean, median, range, IQR, and MAD in context.
What Mastery Looks Like
- Given a data set or graph, students choose useful measures of center and spread and calculate them accurately. They describe clusters, gaps, symmetry, and outliers. They explain what those features mean in the original context.
Common Misconceptions
- Students may treat the mean and median as interchangeable, even when an outlier pulls the mean. They may confuse range with interquartile range or read histogram bars as individual data points. Some describe a graph without connecting its shape, center, and spread to the situation.
How to Assess It
- Exit ticket: Use the data 2, 3, 3, 4, 6, 7, 7, 8 to make a dot plot, find the median and IQR, and describe the distribution.
Lesson moves
Ways to Teach It
Have students measure ten pencil lengths, make a class dot plot, then calculate and compare the mean, median, range, and IQR.
Show two box plots and ask, "Which group is more consistent, and what evidence from the plots supports your answer?"
Run a matching game where students pair data sets with dot plots, histograms, box plots, and written descriptions.
Use local daily temperatures to compare two weeks, then ask which week was warmer and which had more variable weather.
Free download
Printable 6.SP.B Worksheet
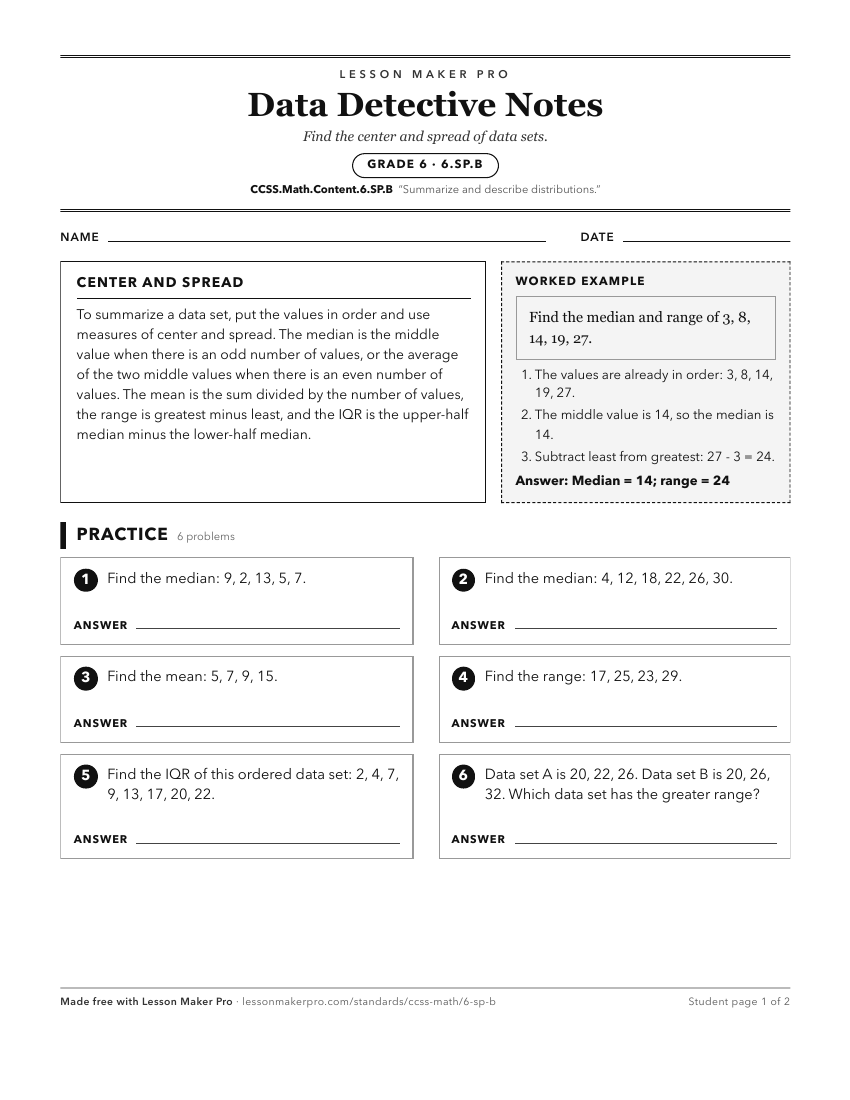
A ready-to-print activity worksheet aligned to CCSS.Math.Content.6.SP.B, with an answer key for the teacher on its own page. No account needed.
PDF, US Letter, prints cleanly in black and white.
Download the worksheetKeep exploring
Related Standards
- CCSS.Math.Content.HSS-ID.A
Summarize, represent, and interpret data on a single count or measurement variable
- CCSS.Math.Content.6.SP.A.2
Understand that a set of data collected to answer a statistical question has a distribution which can be described by its center, spread, and overall shape.
- CCSS.Math.Content.HSS-ID.B
Summarize, represent, and interpret data on two categorical and quantitative variables
Turn this cluster into a lesson
Grade, subject, topic, and the complete cluster are prefilled. Create one free, no account needed.
Also for this cluster:Make a WorksheetMake a QuizMake a Sub Lesson