CCSS.
The Standard
Organize, represent, and interpret data with up to three categories; ask and answer questions about the total number of data points, how many in each category, and how many more or less are in one category than in another.
Common Core State Standards for Mathematics · Measurement and Data
Teacher's field guide
What This Standard Means
What Students Need to Do
- Students sort objects or responses into one, two, or three groups and show the counts in a simple chart or graph. They find totals and compare group counts.
What Mastery Looks Like
- A student can sort data, label each group, and make a chart or graph with accurate counts. They can find the total and tell how many more or fewer are in one group.
Common Misconceptions
- Students may count category labels or graph lines as data points. They may mix up “more” and “fewer,” or name the larger group without finding the difference.
How to Assess It
- Give this list: cat, dog, fish, cat, cat, dog, fish, cat, dog. Have students make a chart, find the total, and compare cats with fish.
Lesson moves
Ways to Teach It
Students sort buttons by color into three cups, count each group, and build a cube tower for each count.
Display three snack-choice columns and ask, “Which choice has fewer votes, and how do you know?”
Partners draw category and number cards, build a three-column graph, then quiz each other about totals and differences.
Survey classmates about three recess choices, record each vote, and report the most popular choice and the vote difference.
Free download
Printable 1.MD.C.4 Worksheet
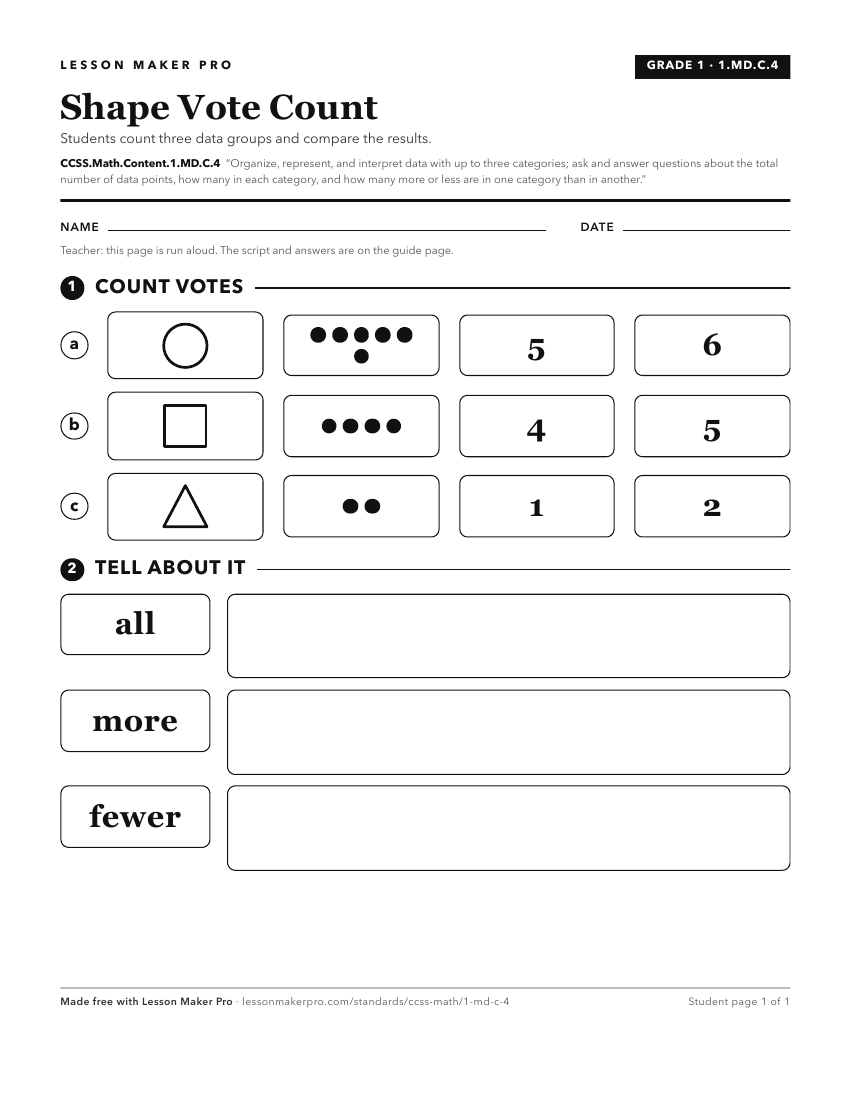
A ready-to-print activity worksheet aligned to CCSS.Math.Content.1.MD.C.4, with an answer key for the teacher on its own page. No account needed.
PDF, US Letter, prints cleanly in black and white.
Download the worksheetLearning progression
Where This Standard Sits
See the whole path on the Measurement & Data progression map.
Before This Standard
If students are struggling here, check these first.
- CCSS.Math.Content.K.CC.B.5
Counting objects accurately carries over to finding category counts and total data points before comparing groups.
- CCSS.Math.Content.K.MD.B.3
Students must sort items into categories and count each category before representing data and comparing category counts.
- CCSS.Math.Content.K.CC.C.6
Comparing groups as greater, less, or equal supports interpreting category counts and answering which category has more or fewer.
What This Unlocks
Mastery here sets students up for these next.
Keep exploring
Related Standards
Turn this exact standard into a lesson
Grade, subject, topic, and the complete standard are prefilled. Create one free, no account needed.
Also for this standard:Make a WorksheetMake a QuizMake a Sub Lesson