CCSS.
Standard Cluster
Represent and interpret data.
Common Core State Standards for Mathematics
Cluster contents
Standards in This Cluster
CCSS.Math.Content.2.MD.D is a cluster heading. These are the individual standards under it.
- CCSS.Math.Content.2.MD.D.10
Draw a picture graph and a bar graph (with single-unit scale) to represent a data set with up to four categories. Solve simple put-together, take-apart, and com...
- CCSS.Math.Content.2.MD.D.9
Generate measurement data by measuring lengths of several objects to the nearest whole unit, or by making repeated measurements of the same object. Show the mea...
Teacher's field guide
What This Cluster Means
What Students Need to Do
- Students collect measurement or category data and organize it in a line plot, picture graph, or bar graph. They use the graph to answer counting and comparison questions.
What Mastery Looks Like
- Students make an accurate line plot, picture graph, or bar graph with clear labels. They answer how many, how many more, and how many fewer questions using evidence from the graph.
Common Misconceptions
- Students may count graph marks without checking what each mark means. They may place data between line plot values, mix categories, or subtract in the wrong order when comparing groups.
How to Assess It
- Give students the data 4, 5, 5, 6, 5, 4. Ask them to make a line plot and write how many measurements equal 5.
Lesson moves
Ways to Teach It
Have pairs measure six pencils to the nearest inch, record results, and build a sticky-note line plot on chart paper.
Show two class graphs and ask, “What claim can you make, and which numbers support it?”
Play Graph Detective: students draw question cards, read a picture graph or bar graph, and explain how they found each answer.
Survey classmates about recess choices, graph the totals, then decide how much equipment each choice would need.
Free download
Printable 2.MD.D Worksheet
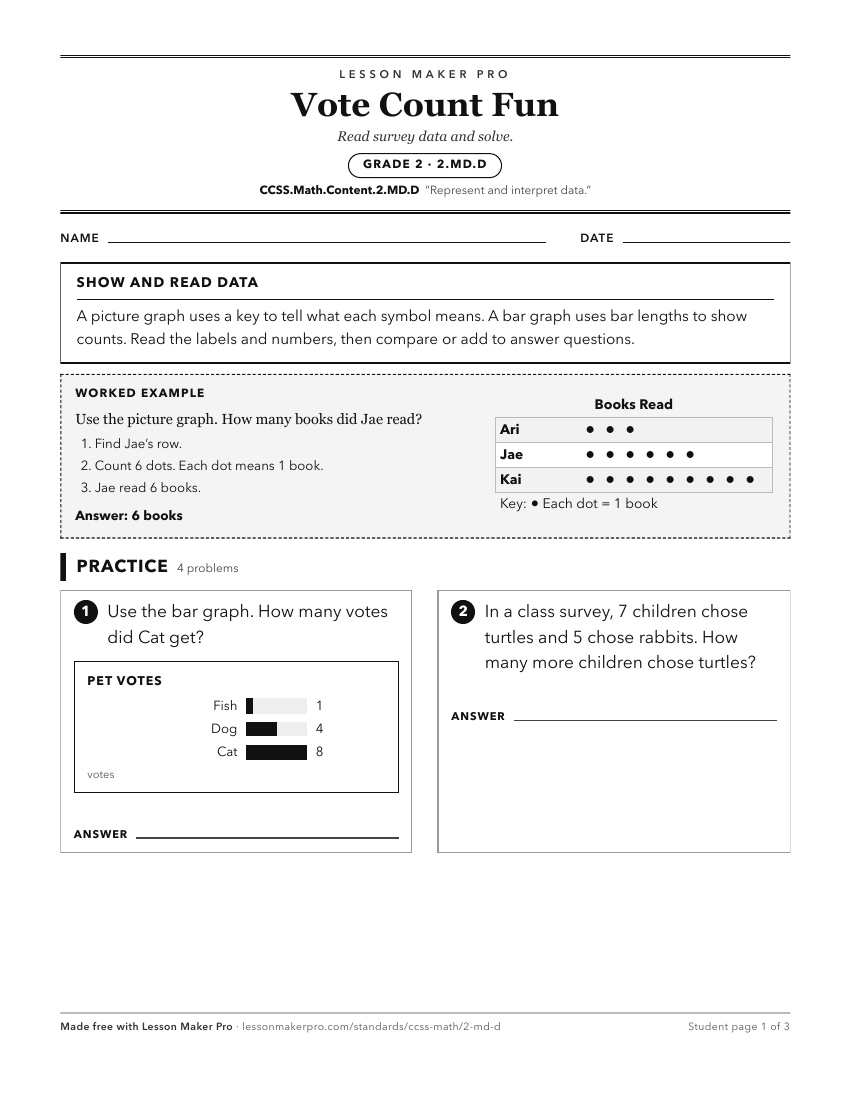
A ready-to-print activity worksheet aligned to CCSS.Math.Content.2.MD.D, with an answer key for the teacher on its own page. No account needed.
PDF, US Letter, prints cleanly in black and white.
Download the worksheetKeep exploring
Related Standards
Turn this cluster into a lesson
Grade, subject, topic, and the complete cluster are prefilled. Create one free, no account needed.
Also for this cluster:Make a WorksheetMake a QuizMake a Sub Lesson